Giorgia Lupi and Stefanie Posavec continue on their path of Dear Data with a book that you draw in: Observe, Collect, Draw!
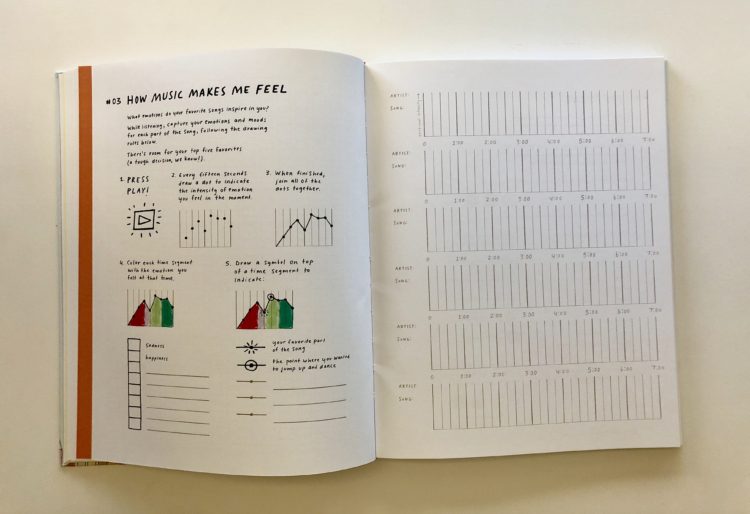
The first section describes some of the basics of journaling with data and how you can use various visual encodings. However, the main part of the book is a journal that guides you through collection and the visual encodings that Lupi and Posavec used with their postcards. First, there’s an instruction page and then the adjacent page provides blank scales for you to sketch yourself.
Fun. It seems like a good way to jog your imagination, in case you feel like you’re stuck in a bar chart geometry funk. [Amazon link]
 Visualize This: The FlowingData Guide to Design, Visualization, and Statistics (2nd Edition)