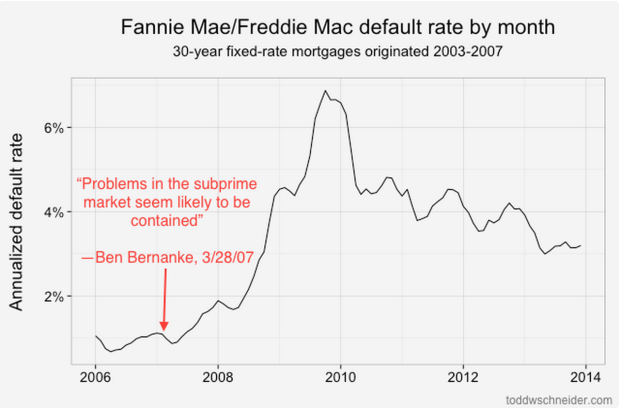
Under the directive of the Federal Housing Finance Agency, started to release detailed loan-level data in 2013. Todd W. Schneider looked at the data recently, evaluating default rates — the proportion of loans that fell into deliquency — with a bit of geography.
California, Nevada, Arizona, and Florida were in particularly bad shape during the 2005 through 2007 bubble. Some counties had more than 40 percent of loans default. I don’t know much about loans, but that seems high. And there was plenty of contrast as you evaluate nearby areas.
It’s less than 100 miles from San Francisco to Modesto and Stockton, and only 35 miles from Anaheim to Riverside, yet we see such dramatically different default rates between the inland regions and their relatively more affluent coastal counterparts.
Aside from the analysis though, maybe the most interesting bit is Schneider’s previous experience as a mortgage analyst and the contrast of analysis a few years ago to now.
Between licensing data and paying for expensive computers to analyze it, you could have easily incurred costs north of a million dollars per year. Today, in addition to Fannie and Freddie making their data freely available, we’re in the midst of what I might call the “medium data” revolution: personal computers are so powerful that my MacBook Air is capable of analyzing the entire 215 GB of data, representing some 38 million loans, 1.6 billion observations, and over $7.1 trillion of origination volume. Furthermore, I did everything with free, open-source software. I chose PostgreSQL and R, but there are plenty of other free options you could choose for storage and analysis.
You can check out the code on GitHub. [Thanks, Todd]


