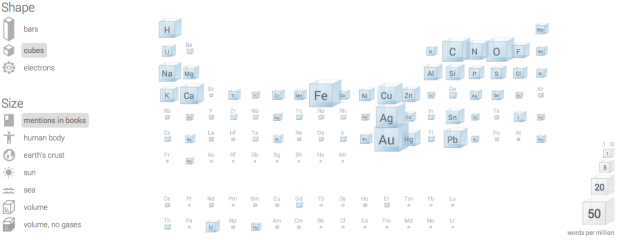
Inspired by a diagram from 1976, the Big Picture group at Google Research built a Periodic Table where elements are scaled based on their use in the world.
For example, the above view shows relative mentions in books for each element. The larger a cube’s volume, the more times that element was referenced in books. Other scalings include the human body composition, Earth’s crust, and the sun.
Fun.


