One of the things that drew me into Statistics is that you can apply it to a variety of fields, and in recent years, more industries hire in-house statisticians (or other varietals of data scientist and analyst). You can work in different industries with the same educational background.
However, the salaries can vary a lot between industries, which made me curious. How does salary vary across industries for other occupations? Here is an interactive to help you see, based on data from the Bureau of Labor Statistics for jobs in 2013. Search for your own occupation or browse random ones to see the changes and differences.
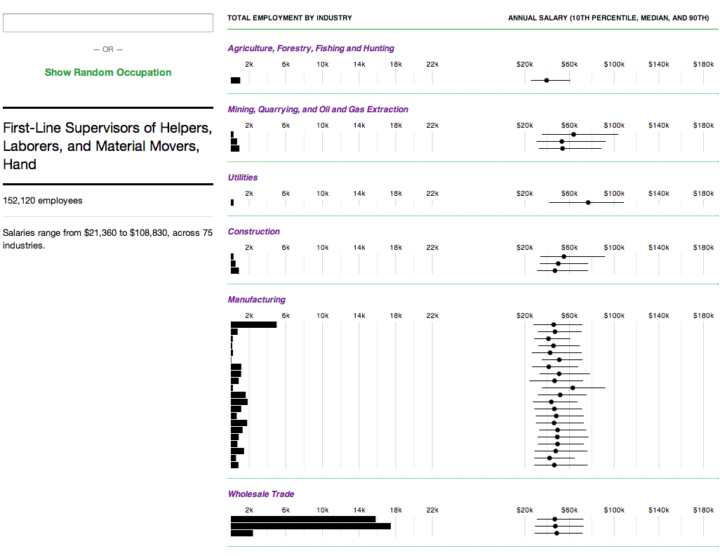
Bar charts on the left show the number of people employed in an industry for the selected occupation, and the ranges on the right show annual salaries from the 10th to 90th percentile. The dot in the middle of the line is the median salary. Mouse over bars and lines for more information about each industry.

Some occupations are specific to certain industries. For example, registered nurses are primarily in the health care sector. Although, it is not completely uncommon to find nursing jobs in other places such as in government or educational services, as shown above.
On the other hand, network and computer systems administrators work in lots of industries, and salaries range from $32,050 all the way up to $158,170 (10th to 90th percentile). In fact, with most industries and occupations, the salaries can vary by orders of magnitude. There’s plenty to glean from the data, but if there’s one takeaway, it’s that if you’re really good at what you do, you can make a good salary.


