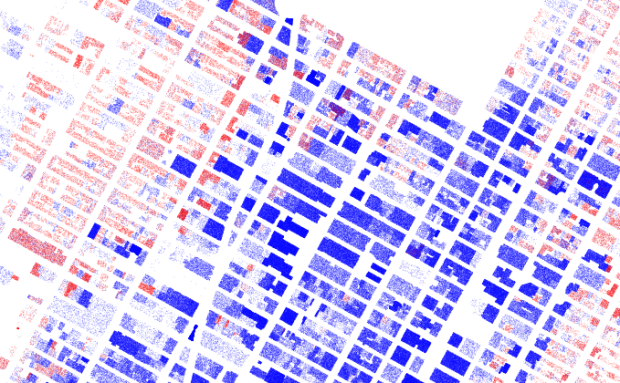
Open data consultancy Conveyal released Disser, a command-line tool to disaggregate geographic data to show more details. For example, we’ve seen data represented with uniformly distributed dots to represent populations, which is fine for a zoomed out view. However, when you get in close, it can be useful to see distributions more accurately represented.
If the goal of disaggregation is to make a reasonable guess at the data in its pre-aggregated form, we’ve done an okay job. There’s an obvious flaw with this map, though. People aren’t evenly distributed over a block — they’re concentrated into residential buildings.
So Disser combines datasets of different granularity, so that you can see spreads and concentrations that are closer to real life.


