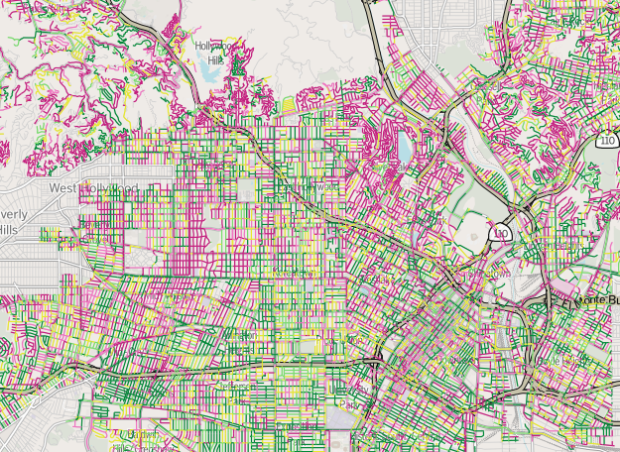
Nevermind the horrible traffic in Los Angeles, where it takes a several hours to get somewhere when it should only take thirty minutes. The road quality isn’t so great either. Using data from the Los Angeles Bureau of Street Services, which scores street segments on a 100-point graded scale, Ben Poston and Ben Welsh for The Los Angeles Times mapped road quality in the city.
Red represents segments with an F grade, which means resurfacing or reconstruction is required, and green are segments with A grade, which mean no cracking and no maintenance required. Yellow is everything in between. Jump to a specific area via text entry and/or see the data in aggregate, by neighborhood or council district.
The streets don’t look great almost any way you look at it.
 Visualize This: The FlowingData Guide to Design, Visualization, and Statistics (2nd Edition)
I would love to see this overlaid with other statistics, like median household income, census data, real estate, crime, etc. Is there any correlation?
For the recommended maintenance schedule (slurry seal, slurry seal, resurface — on a 20 year cycle), a square foot of paved road costs ~$2.50 per 20 years = $0.125/year . If a road is about 35ft wide on average and there are 6500 mi of paved road in LA, that’s about $150M/year, or $38 per person per year. For comparison, the LA city budget is $7.7B so street maintenance should be just 2% of the budget. Hmm, wonder where the money is going!
I’ve lived in a few places, including LA, and the worst roads, on average, seemed to be in Omaha. LA’s aren’t so bad because you often aren’t moving very fast which minimize the shock value of pot holes. In Omaha you can hit them at full throttle.
Chris: the article (as well as map) suggest there are quite a few wealthy neighborhoods with bad roads and poorer ones with decent roads.