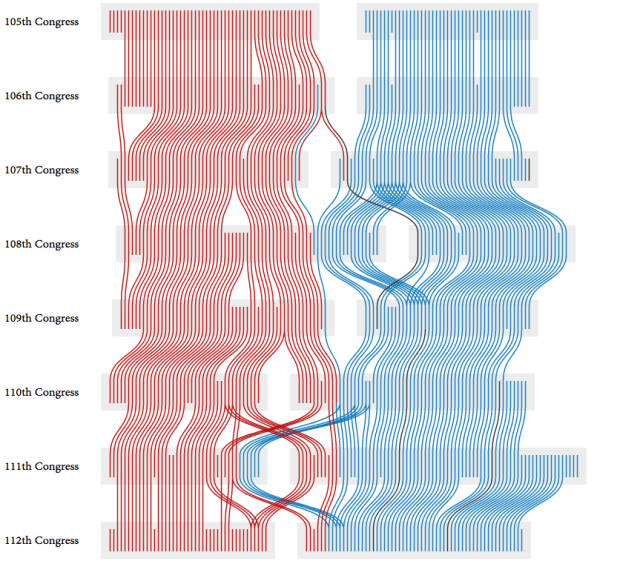
PhD student Adrien Friggeri demonstrates a new clustering algorithm with a visualization of the agreement groups within the United States Senate over time.
As you might imagine, there are two obvious groupings, Republican and Democrat. It gets interesting though when you look at Democrats classified as Republicans and vice versa. For example, the 11 Republicans placed in the Democratic group of the 110th Congress:
Most of whom are either moderates or closer to the Democrats than to their own party. Charles Hagel was critic of the Bush Administration which he described as “the lowest in capacity, in capability, in policy, in consensus — almost every area” of any presidency in the last forty years. George Voinovich has been known to oppose lowering taxes and frequently joined the Democrats on tax issues. John Warner is a moderate Republican and has centrist stances on many issues, to the point that he once faced opposition of other members of his own party when he decided to run for re-election.
Be sure to click on the gray boxes to follow the trajectories of different cohorts.


this is an interesting pattern generator, essentially a muti-track time line.
It could be enhanced with the addition of some other selected topics, such as changes in the senate rules requiring 60 votes rather than a majority
Do you mean when the cloture rule was amended from 2/3 of the senators present and voting to 3/5 of the duly chosen and sworn senators? This change was made in 1975 (94th Congress–prior to this chart’s beginning) and is an easier threshold to meet for ending debate on an issue. The senate always has and continues to only require a majority for most votes.