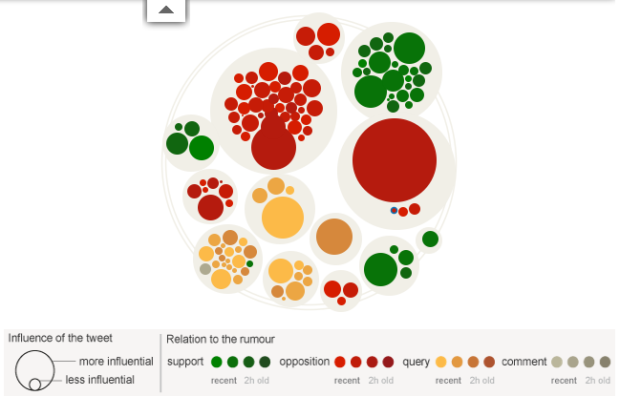
During the riots in London this past summer, a lot of information spread quickly about what was going on. Some of that information was true and some was not so true. The Guardian explores this spread of information on Twitter, and how fact and fiction seem to reveal themselves on their own:
A period of unrest can provoke many untruths, an analysis of 2.6 million tweets suggests. But Twitter is adept at correcting misinformation – particularly if the claim is that a tiger is on the loose in Primrose Hill.
Other rumors include when rioters cooked their own food at McDonald’s (false), London Eye was set on fire (false), and Miss Selfridge was set on fire (true).
Each bubble represents a tweet and is sized by number of followers the tweeter has. The big one is usually the orignal tweet and the small ones that cluster around are retweets. Then the colors represent tweets that support, oppose, question, or comment. So when you play the animation for each rumor, bubbles swiftly pop up at the rumor peaks and then settle at true or false.
You can also use the scroll to move to a certain point in time, and roll over bubbles to see the tweets.
Really nice graphic and worth a look.
[Guardian via @jakeporway]


Thanks Nathan! As a quick aside, the final implementation of the key mistakenly transposed the colour scale (as Moritz and others noticed). We’re fixing that forthwith, so newer items will get lighter with age.
how was this graph made? what application was used?
How it was built: http://www.guardian.co.uk/news/datablog/2011/dec/08/twitter-riots-interactive