Some little birds told me that they received their “coming soon” notifications from Amazon about Visualize This. Exciting. (Thanks, pre-orderees :). I just got the PDF of the book not too long ago, but I can’t wait to get the physical copy resting in my hands. Paper! In anticipation of the upcoming release, I’ve posted some previews of what you can expect.
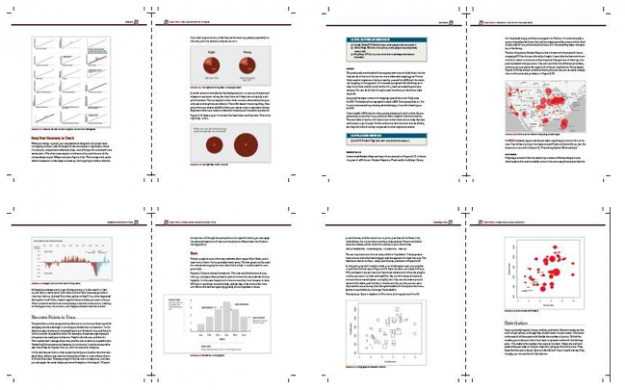
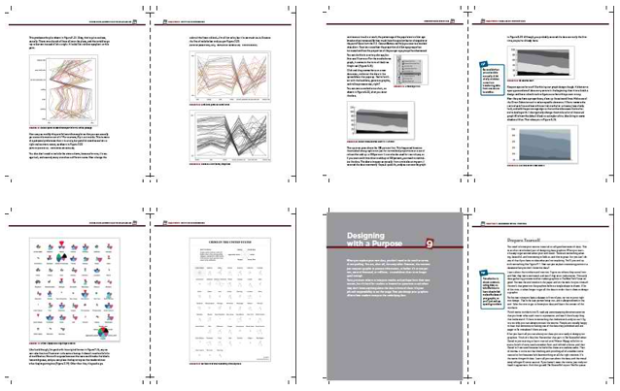
There are pictures on just about every page, so you’ll be able to follow along easily as you work through and learn from examples. There are only a handful of spots in the book where there are actually two whole pages in a row without a figure in it. And it’s all in color. So the visual aspect definitely dominates.

When I was first figuring out what an outline of the book would look like, I knew I wanted straightforward, working examples that let you get your hands dirty with different tools. One route could’ve been tool-centric where a chapter might be on static data graphics and another might be on interactive ones.
That’s not how I (or those I’ve worked with) really go about things though. Scratch that.
You don’t find a tool, and then go look for data that you can plug in. It’s the other way around. You get your data, decide what you initially want to know about it, and then pick the tool that’s right for the job.
In other words, you let the data guide you.
So the chapters are organized by data type (time series or spatial, for example) and what you’re looking for (like outliers or relationships). Rather than trying to cover every tool for every single data type, the book starts with Illustrator and simple one-liners in R, and progresses to more advanced programming. While each technique is presented in the context of a specific data type, you’ll gain the logic that applies to any of your data, and you’ll be able to tell your own data stories. The logic and flow is the important bit. After that, the rest is just syntax.
Check out the new site for Visualize This, and of course the previews are there, too. More to come.


Nathan, any plans to offer an e-book version as well? (I’d probably grab both – e-book for reference, but the print edition for the color slides, as these are never as good in an e-book, imo.)
@Paddy – Yep, I’ve been told that it’ll be available in all major digital formats e.g. for Kindle and iPad :)
Cool! How would you compare this to Stephen Few’s book, “nformation Dashboard Design: The Effective Visual Communication of Data” – I’m guessing less dashboard-y, more infographic-y?
Off to order a copy of Visualize This now…
@Chris – Thanks!
The two books are very different from different points of view. If I were to name one main difference though, it’d be that Visualize This focuses much more on the how, whereas other books focus more on the what.
Pre-ordered!!
Thanks!
I am late turning in my Fall book order for my data visualization course. I’d love to be able to see these pictures better so I can know whether I should assign your book for my course. Any chance you could show these pictures a little larger?
@Megan – In the top right of the Wiley listing, there’s a link for instructors to request an evaluation copy:
http://www.wiley.com/WileyCDA/WileyTitle/productCd-0470944889.html
I hope it finds its way into your course :)
Congrats. Looking fabulous. *Very* glad to find out you’re having a Kindle version for my iPad.
Flowing Nathan! Congratulations. I’ll spread the word. Looking forward to downloading!. :)
I am charting my impatience as I wait for my pre-ordered copy to arrive. After your post today there is a clear change-point in my plot.
I ordered the book a few weeks ago. I am looking forward to have it in my hand.
Nathan, keep up the good work and keep the blog posts coming!
Cheers!
Waiting for the ebook!
=)
this is looking good.
i know that you use a variety of different tools, are you thinking about providing any code snippets – say as an online resource. nothing like being able to reproduce the analysis with our own data ;)
It was serendipitous for me. Don’t know if I found your website or the other way round. I’ve been looking for formats & techniques of data/info/insight visualization. As an innovation facilitator Visualize This is just what I need. Ordering it right away. Thanks Nathan!
Come on Nathan – finish it already ;-)
I heard pre-orders make book launches come sooner :)
Ordered. Super pumped!
Ordered from Amazon UK – can’t wait!!
Received notice that the book is shipping earlier than expected and that I’ll receive it on the 13th!