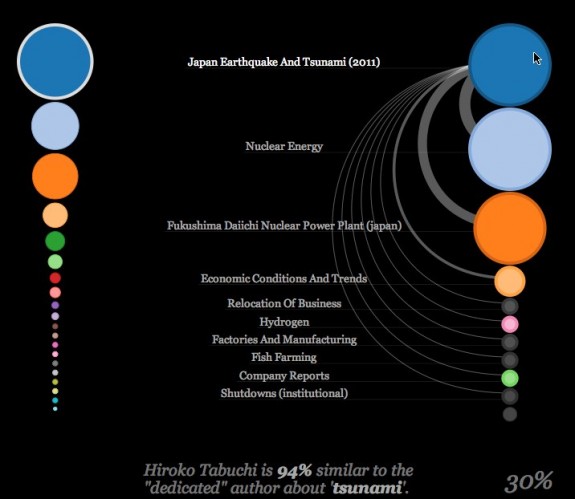
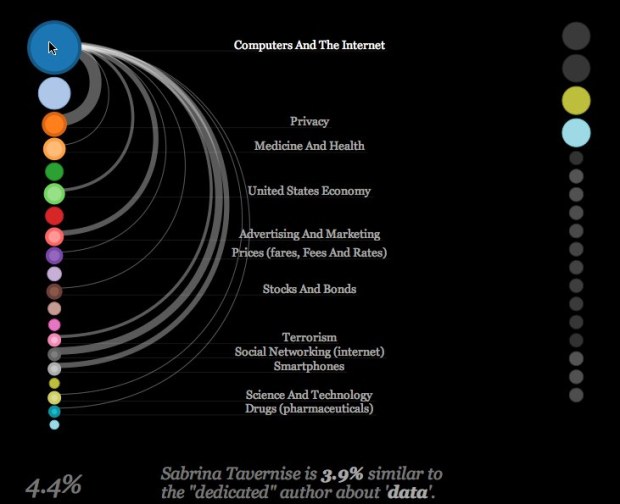
The IBM Visual Communication Lab published their first of what I hope many sketches exploring topics covered by The New York Times and its authors called NYTimes Writes, by Irene Ros. Start with a search term, and the tool will fetch related articles from the past 30 days. You’ll get something that looks like the above, which is what I got when i searched for “data.”
There are a few things that you will see once the search is complete. First, on the left side of the screen you will see a stack of bubbles at varying sizes. Each bubble represents a term, or “facet”, that was used to describe one or more articles containing your search query. Facets get manually attached to each article by The New York Times staff. An article about “Tsunami” might be tagged as being about “Natural Disasters,” for example. The size corresponds to the relative amount of times that tag appeared comparing to all the other facets collected from all other articles in the query set.
You can mouse over each facet to see what others were used with it, and the width of an arc represents how many times two facets were used together. For example, as seen above, “data” is used most often associated with computers and Internet, which in turn is often associated with privacy.
Similarly, you can select an author (right) for a view of what he or she writes about. Since data can be a fairly broad topic, the author stacks don’t match up that closely with the topic stack, but with say, a search for “tsunami” will provide a different result. For example, Hiroko Tabuchi, who has been covering the tsunamis in Japan, has a similar stack to that of the topic stack.

Your turn. Give NYTimes Writes a try, and share any finds in the comments.
[NYTimes Writes | Thanks, Irene]


