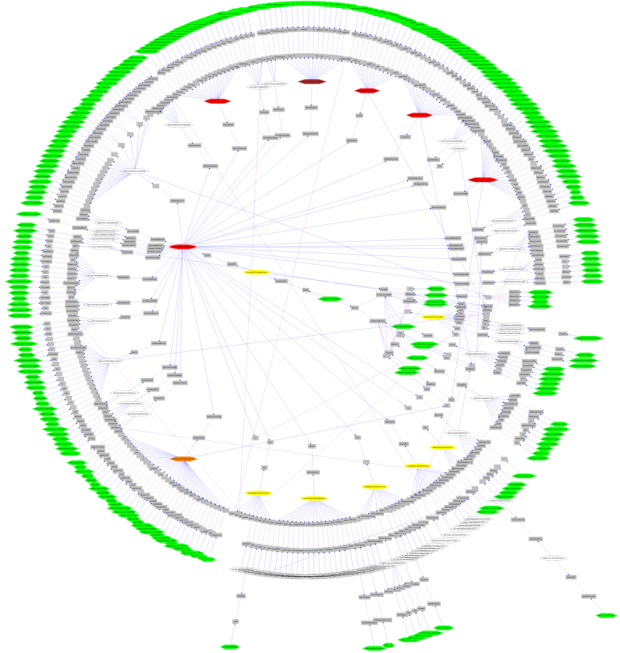
AT&T Labs’ Infoviz research group describes network graphs and their many uses:
There is information in the connections. A glance is enough to identify nodes with the most links, nodes straddling different subgroups, and nodes isolated by their lack of connections. Corporations might look at a graph to verify that marketing and sales are communicating, urban planners to monitor the interconnectedness, or isolation, of neighborhoods, biologists to discover interactions between genes, and network analysts to monitor security.
And on aesthetics:
Aesthetics is important not so much for looks—though some visualizations can be stunning to look at—but for readability. Links that intersect and nodes that overlay one another result in poor readability, and graph visualization programs work hard to minimize the number of link intersections and give enough whitespace around each node to make it stand out from its neighbors.


 Visualize This: The FlowingData Guide to Design, Visualization, and Statistics (2nd Edition)

There are dozens (hundreds?) of interesting (and pretty) graph visualization in a gallery here:
http://www2.research.att.com/~yifanhu/GALLERY/GRAPHS/index40.html
Many
The following URL has a gallery with hundreds of network graph visualizations. Many of these appear to be for telecommunication networks. Click on the different pages and see some very different styles.
http://www2.research.att.com/~yifanhu/GALLERY/GRAPHS/index1.html
Here’s a set of graphs showing ‘something’ regarding Google, Slashdot, Livejournal, Gnutella and something related to a Berkeley-Stanford network.
http://www2.research.att.com/~yifanhu/GALLERY/GRAPHS/index111.html