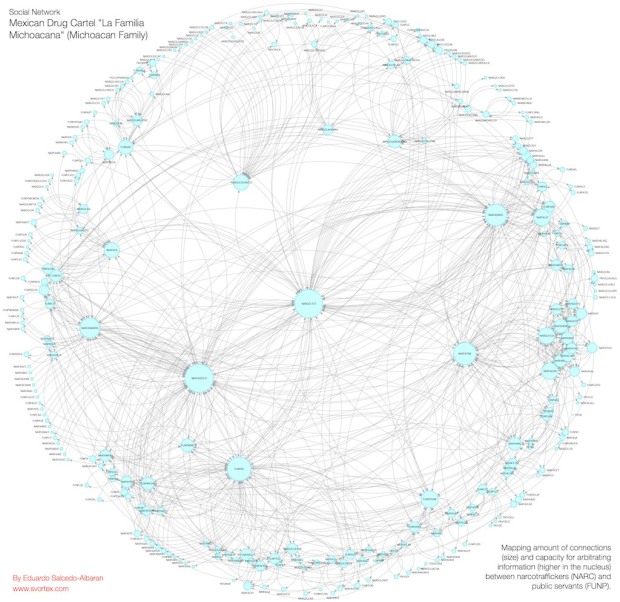
I’m not entirely sure what we’re looking at here, other than relationships between Mexican drug cartels. Maybe someone can shed some light on the subject.
[Edge via We Love Datavis]

I’m not entirely sure what we’re looking at here, other than relationships between Mexican drug cartels. Maybe someone can shed some light on the subject.
[Edge via We Love Datavis]
Mexican ‘mafia’
http://en.wikipedia.org/wiki/La_Familia_Michoacana
Data is probably from Project Coronado..
You could probably send an email or a tweet to the guy named in the lower left corner — Eduardo Salcedo-Albarán — for the full story.
This was also featured on http://www.fastcodesign.com, with an explanation of how to read it. Basically it shows the integration between cells of La Michoana and Government agencies, and the amount of information flowing between them:
http://www.fastcodesign.com/1662638/infographic-of-the-day-the-power-structure-of-a-mexican-drug-cartel
Scary.
thanks, amy.
How to draw this kind of map?
I wonder these nodes are manually placed?
The diagram looks sort of like a Gephi mapping, because of the curved network edges.
The layout looks like a force-directed layout with a fish-eye projection… but I’m not sure. =P
Thank you for your comment.
I hope an actionscript version of JUNG, java graph library, or any graph layout engines.
In the bottom right corner. There is a short explanation.
1. narcotraffickers ← connection → public-servants
2. capacity for arbitrating information