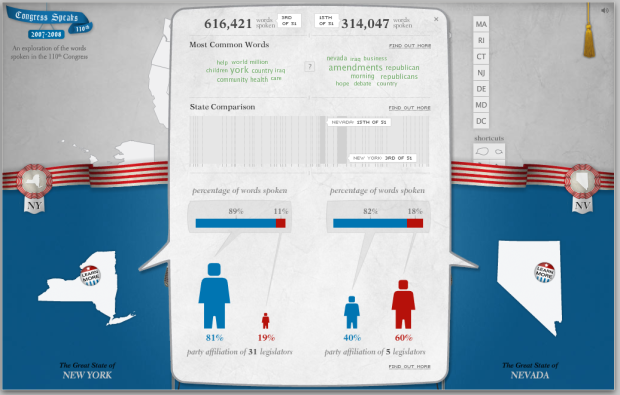
There’s a lot of talking in congressional meetings, but what are your state senators and representatives talking about? Design group Periscopic explores what congress men and women said from 2007 to 2008 in this tongue-in-cheek comparison tool with talking heads. The best part about the tool is that behind the humor is actually something useful.
Compare word distributions of senators, of states, of a senator to a state, or representatives, so on and so forth. We get breakdowns by gender, number of words spoken, and by state. All data come from public records.
[via @krees]


This would be very interesting if it were integrated into Open Congress with live data. Particularly comparing individual representatives. I’m not sure I understand their comparison of California, which has 57 reps, with DC, which has 1 rep. and no vote. There is an obvious reason why one state is first and the other is last.
but you can select what states you want to compare, so it’s not as obvious when you compare say, north dakota and south dakota
Pingback: Visual Friday: Congress Speaks - Spotlight Effect - carrièremagazine voor communicatietalent
Pingback: links for 2009-07-31 - Kevin Bondelli’s Youth Vote Blog
Pingback: goodness in sharing…
Pingback: Reading blogs #17 : ::: Think Macro :::
I think it is interresting to see which words are used more often. It hints at a degree of state-centrism that is much larger in some states than others. For example CA vs. IA. I also found interesting the difference in party members compared to the ammount that a party spoke. Some parties are much more outspoken than others it seems. Awesome visual data!
I agree. In Ohio 59% of the legislators are Republican, however they only spoke 28% of the total words. The opposite happens in Pennsylvania.
Pingback: Congress Speaks: All Words Spoken in the 110th US Congress | thegraffik | Design and Illustration
Pingback: Congress Speaks: All Words Spoken in the 110th US Congress | Modern Ui