Dual axes, where there are two value scales in a single chart, are almost never a good idea. As a reader, you should always question the source when you see a chart that uses such scales. Zan Armstrong explains with a recent example.
One of the best descriptions I’ve heard for data viz is that: when the data is different, the viz should look different and when the data is similar, the viz should look similar.
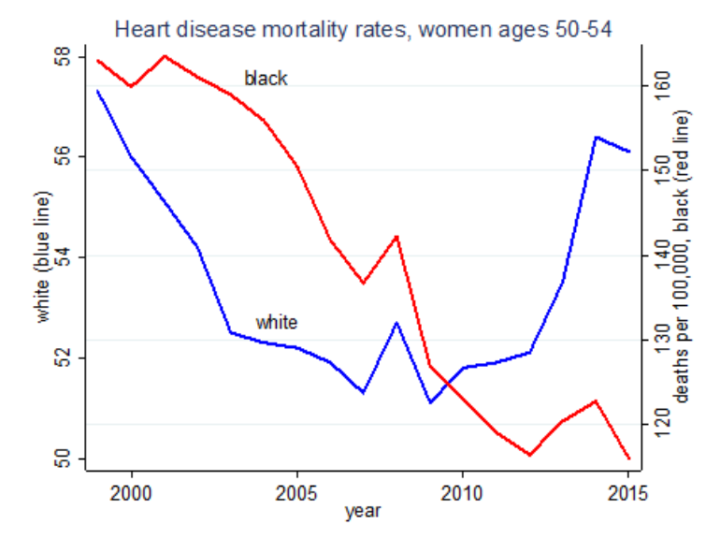
If you allow yourself to have two y-axis for the same metric, with both a different scale on each axis and a different base value, then you can make a lot of charts with the exact same data that look very different.
If there’s a direct transformation between the scales, say between metric and Imperial units, then okay, that’s fine. In almost all other cases, people use dual axes to overemphasize a relationship between two variables, and you should wonder why the maker did that.
 Visualize This: The FlowingData Guide to Design, Visualization, and Statistics (2nd Edition)