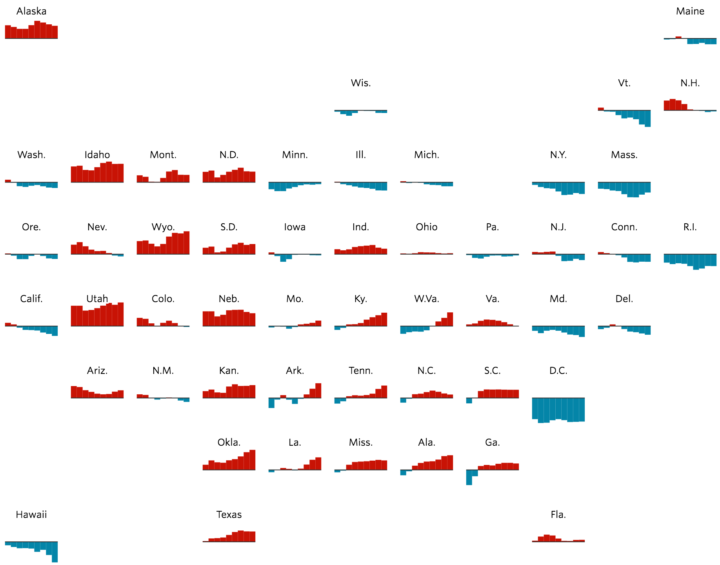
You’re likely familiar with the state grid map form used these days. Instead of using geographic boundaries, you place states in a grid layout, giving an equal-sized cell to each state so that they all get the same visual weight. The Wall Street Journal combined it with a time series for each state in their field guide to shifting states.
The country is more than just red states and blue states. Some former battlegrounds have moved to the sidelines. Other once reliably Republican or Democratic states have come into play as the composition of their electorates change.
Red means more Republican than the national popular vote, and blue means more Democrat.
The slow, animated load makes the map. It reminds me of the New York Times’ “wind” map from the previous election. Life-like.

 Visualize This: The FlowingData Guide to Design, Visualization, and Statistics (2nd Edition)