Mapping slavery from a historical perspective is a challenge, because many old maps and estimates are at the county level. Boundaries changed and counting methods changed, which provides for variation over time and geography. Cartographer Bill Rankin tries to find balance between accuracy and readability in a set of maps that show slavery in a grid layout from 1790 to 1870.
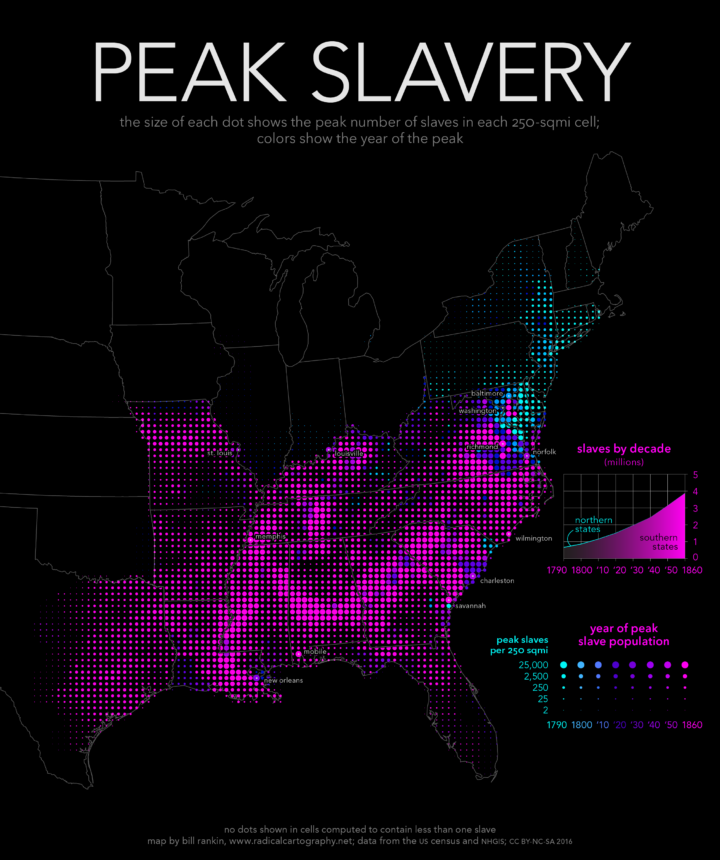
Rankin made a map for each decade, but the most interesting one that shows all the data at once. Size of each circle represents the peak number of slaves per 250 square miles. Color represents the year this peak occurred.
[This] map shows the peak number of slaves in each area, along with the year when slavery peaked. Except in Delaware, Maryland, and eastern Virginia, slavery in the south was only headed in one direction: up. Cartographically, this map offers a temporal analysis without relying on a series of snapshots (either a slideshow or an animation), and it makes it clear that a static map is perfectly capable of representing a dynamic historical process.
 Visualize This: The FlowingData Guide to Design, Visualization, and Statistics (2nd Edition)