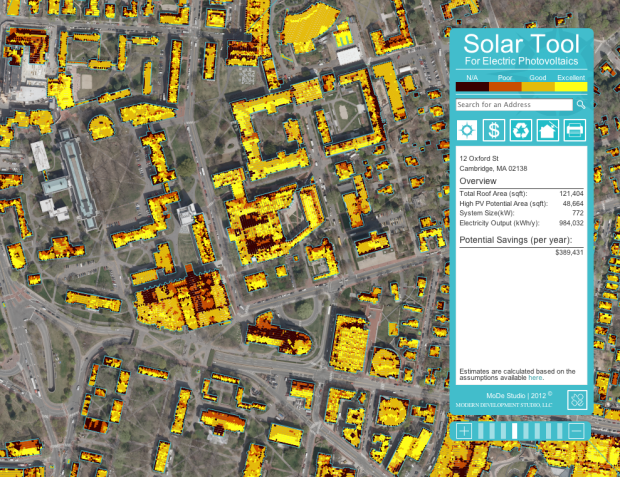
Sustainable Design Lab at MIT and MoDe Studio estimated the potential hotspots for electric photovoltaics in Cambridge, Massachusetts and mapped it.
“High PV Potential Area” is the footprint, in square feet, of the portions of a roof that, by considering both the real surface projection to its actual slope and this surface’s annual irradiation, yield a “good” to “excellent” result. These values are based on MIT’s calculations and are shown as orange and yellow dots on the viewer, respectively.
If all the door-to-door salesmen trying to sell me solar panels showed me something like this for where I live, I’d be a lot more receptive.
 Visualize This: The FlowingData Guide to Design, Visualization, and Statistics (2nd Edition)
This is crazy. Cambridge is in the bottom quartile of the US in terms of solar insolation, the best metric of rooftop PV potential. It has half the solar insolation of the desert southwest (a metric that looks at both total sunny hours as well as sun angles). No site in Cambridge could possibly be “excellent” for rooftop PV
You’re only looking at half the equation. Insolation and the price of electricity from the grid have roughly equal weight. You note that Cambridge has half the insolation of the desert southwest, but you completely ignore the difference in the cost of electricity from the grid in the two locations. If electricity costs twice as much in Cambridge (and it does, roughly speaking), then from an economic standpoint PV is equally viable in Cambridge and the desert southwest. And in fact, Massachusetts is one of the largest PV markets in the US (though it is still well behind California and New Jersey).
}}}} If all the door-to-door salesmen trying to sell me solar panels showed me something like this for where I live, I’d be a lot more receptive.
Then you’d be a fool, for the reasons Warren Meyer says.
James vastly overestimates the value that a half of the solar insolation values represent, because presumably he has no background in business, lacking any grasp of the concept of ROI as well as lost Opportunity Costs. That same money, instead of being placed into ridiculously ineffective and expensive solar PV could instead be invested into other, far more profitable power generation mechanisms that would make far more sense.
@IGotBupkis, I find your comment hilarious considering that my day job is to make a positive ROI off of solar energy for one of the largest companies in the world (one that has its hands in many, many power generation technologies). If you’re not willing to do something about your ignorance regarding solar power, do us all a favor and refrain from commenting about it….
C’mon, folks. You clowns at MIT keep up this green energy nonsense I’m going to have to burn my ph.d. (1995). Try to divorce your leftie values from your research, ok?
Weirdest. Trolling. Ever.
So, if the Massachusetts Institute of Technology keeps on researching how technology can be applied in Massachusetts, some guy will burn his phd. And they should filter out findings from their research that people with right wing political affiliations don’t like (presumably, else that guy will print another copy of his phd and burn it again).
The internet is a weird, weird place.
No, Al, this is a stupid abuse of data manipulation to push a stupid, ineffectual green meme.
As Warren Meyer notes above, it is just flat out stupid to be installing solar PV in a place with such astoundingly poor Solar Insolation values as New England. As long as it takes for solar PV to pay for itself in a place like Arizona, It most likely will NEVER pay for itself (especially if you eliminate extensive government subsidies) in places like NE. It’s a stupid boondoggle, and it is shameful that MIT would release something so utterly and clearly knowingly ignorant of the significance of SI on power production and how “worthwhile” it is to have solar panels.
Love your work Al!!!
Oh Dr George, do you really have to troll so early in the piece and let everyone know of your ph.d endeavours.
You do realise you have not actually contributed, dont you??
Does anybody know how the data behind this was collected? Did they go out and survey every building on every street measuring roof angle, or is there an existing public source of such data, or did they infer roof angle (e.g. by comparing satellite photos at different times of day, perhaps?). I can’t find any info on that on the linked site.
It’d be great to know if it’s a method that can be easily generalised to any area with decent satellite coverage. If it was, something that would be really really interesting would be a fully zoomable map where you can zoom out to see and compare aggregated averages of streets, districts, settlements, states and countries – and where there were two views, one showing PV potential, the other showing local $ value of the potential electricity. I’d love to see how different or similar those two views are.
It would only be worthwhile if it had parameters for
1) The effective net efficiency value of the solar panels
2) The solar insolation in the area
3) Historical electrical rates for the area in question
4) Cost of the solar installation
5) Area of coverage expected
6) A fairly straightforward ROI calculator utilizing the above numbers.
… Of course, this would show what kind of idiotic idea solar is, so of course, they’ll never do it.
LiDAR Data, you idiots.
…because how many people can there be who are electricity consumers, but who aren’t familiar with the collection methodologies and uses of LiDAR data?
I’ve literally never met anyone who uses electric lighting in their homes who hasn’t read Nguyen, Pearce et al’s 2012 paper, “The Application of LiDAR to Assessment of Rooftop Solar Photovoltaic Deployment Potential on a Municipal District Unit”, which describes a methodology for the application of Light Detection and Ranging (LiDAR) to automated solar photovoltaic (PV) deployment analysis on the regional scale.
This thread has taken an odd and unexpected turn.
Just look at what Germany has already done, despite its terrible solar insolation….
What exactlythesemeasures According toPhys Org,
over 80 percent of electricity from photovoltaic jobs uk sources by
2050. The company falls into the” other” category,
which means it faces a great deal more challenges than other
budding green technologies. 9% Revenues from co-products, feedstock sales, demurrage,
and storage amounted to $24. With power generation from green sources has already doubled
in the U. Dr Arvizu said that critics of photovoltaic jobs uk energy we generate from sources energy.