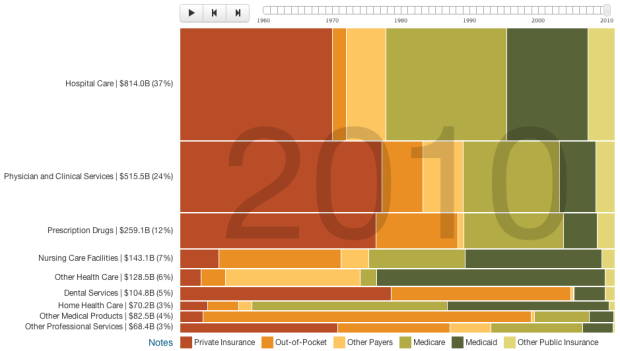
Josh Cothran looked at who’s paid for healthcare over the past five decades, with an animated Marimekko chart.
In 1960, almost 100% of the spending on prescription drugs came out of the consumer’s pocket; by 2010, out-of-pocket spending was down to 20%. Over the past 50 years, there have been major shifts in the way hospital care, physician services, long-term care, prescription drugs, and other services and products are paid for. This interactive graphic uses data from the Centers for Medicare and Medicaid Services to show national spending trends from 1960 to 2010 for health care by payer.
In case you’re unfamiliar with the layout, there are two visual dimensions to the Marimekko. On the vertical is percentage for the main categories: hospital care, physicians and clinical services, etc. On the horizontal is a breakdown of the main categories: private insurance, Medicare, etc. The animation brings time as a third dimension for which the overall size of the chart is constant, so pay attention to the changing relative percentages.
 Visualize This: The FlowingData Guide to Design, Visualization, and Statistics (2nd Edition)
I think this chart is sort of misleading in that it’s based on percentages rather than actual costs. So, sure, you can frame it as… “In 1960, almost 100% of the spending on prescription drugs came out of the consumer’s pocket; by 2010, out-of-pocket spending was down to 20%”. This makes it sound like people are not as responsible for their prescription drug coverage anymore.
But looking at the actual data, in 1960 consumers spent 2.6 billion on prescription drugs (out-of-pocket), and in 2010 they spent 48.8 billion (out-of-pocket). So even if a greater percentage is covered by other means, people are still on the hook for a huge amount of money. In fact, I think it’s about 4 times the rate of inflation.
Inflation! You could adjust with CPI to get constant dollar estimates, but that won’t reflect reality either since price changes in healthcare were quite different to overall CPI. I think % are very objective in this case…
IMHO, I might suggest that this entire chart should be nested in a larger box. The nested portion could then grow/shrink to reflect Healthcare as % of GDP. That would provide a frame of reference (pardon the pun). Percent of GDP is the standard measure the OECD uses when discussing overall healthcare spending and when doing cross-country comparisons.
Don’t even get me started on health outcomes and % of national population covered…