The geographers at Floatingsheep are at it again, this time comparing tweets that mention beer and those that mention church.
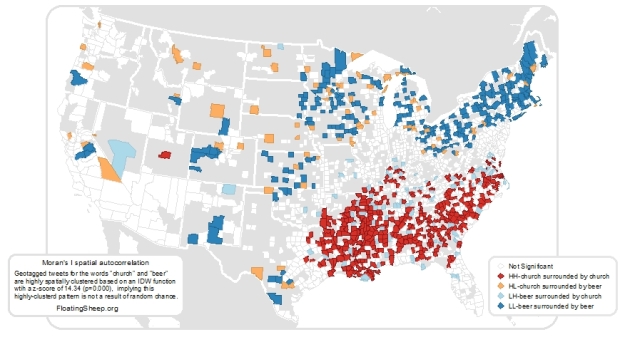
Given the cultural content of the “church” tweets, the clustering of relatively more “church” than “beer” content in the southeast relative to the north-east suggests that this could be a good way to identify the contours of regional difference. In order to quantify these splits, we ran a Moran’s I test for spatial auto-correlation which proved to be highly significant as well. Without going into too much detail, this test shows which counties with high numbers of church tweets are surrounded by counties with similar patterns (marked in red) and which counties with many beer tweets are surrounded by like-tweeting counties (marked in blue). Intriguingly there is a clear regional (largely north-south split) in tweeting topics which highlights the enduring nature of local cultural practices even when using the latest technologies for communication.
I wonder if searches for “ate too much” or “out for a run” would match up with obesity trends. Hopefully their Data on Local Life and You (DOLLY) project comes to fruition.
 Visualize This: The FlowingData Guide to Design, Visualization, and Statistics (2nd Edition)
An amazing study – and the results are pretty clear cut (even without the fancy statistics!). Just wondered whether the pattern would be similar if ‘beer-tweets’ were substituted by e.g. ‘whiskey-tweets’ – i.e. that the ‘church-goers’ simply drink something else rather than subscribe to sobriety ;-)
In response to Advisor Norwich–I would make a supposition that the survey may not even be about sobriety but rather a ‘life-attitude’. Whiskey drinkers rarely talk about drinking whiskey, whereas beer (and wine) drinkers have a different ‘life-attitude’: they talk about the things that they enjoy. I’m from Australia and am supposing that if the same survey was done here it would be almost all blue!