For the MIT Sloan Sports Analytics Conference a few weeks ago, Stanford biomechanical engineering student and Ayasdi analyst Muthu Alagappan presented his work on redefining basketball positions.
After studying players like LeBron James and Blake Griffin, many analysts are now suggesting that there are new positions, which are simply hybrids of the one’s we already had. For example, some players are now labeled “point-forwards” or “combo-guards.” But what if we were wrong about our initial five positions. Maybe a “Center” is just a label for people over a certain height, and there are actually three different types of big men in the NBA.
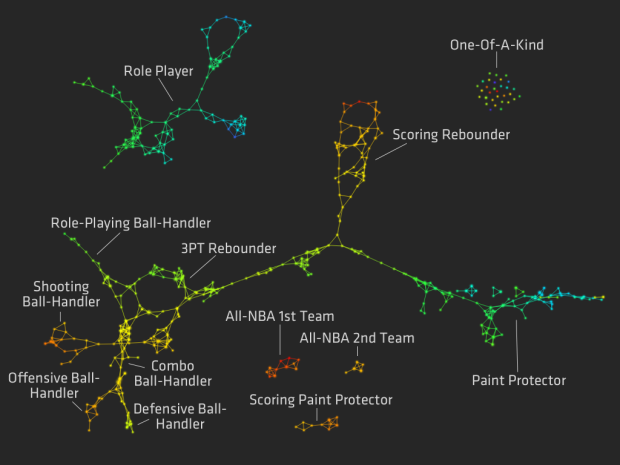
An analysis, done with data exploration tool Ayasdi Iris, provided 13 possible positions, as shown above. Nodes and edges are colored by points per minute on a blue (low) to red (high) scale.
So for example, those typically classified as centers or power forwards are classified as scoring rebounders, paint protectors, and scoring paint protectors. Dirk Nowitzki might be considered a scoring rebounder, whereas Joakim Noah is a paint protector.
The point? Hopefully teams can use this information to make better decisions about who to trade and draft. Of course, I’m sure scouts know about these fuzzy positions already, so I think the next step is to look at what positions the best teams have and had, and more importantly, how a “one-of-a-kind” player can change everything.


So what’s the data that the graph is based on?
Like this it means nothing at all.
The slidehow is handy in figuring out that it is based on actual player data (it looks to be a number of statistics such as points, blocks, etc, per game). The problem is that the actual player data has multiple dots for a single player.
In the end, the graph for the champion Mavericks looks very much like the graph for the deadful Timberwolves.
My guess is that it’s a strange visualization of principal components / factor analysis on NBA players. I would claim that it fails in the end, mainly because I still have no idea which players / teams are better (or even different) after looking at it.
Info and PPT here http://www.sloansportsconference.com/?p=5431
If there’s a paper available, I’d like to see it because the slides don’t tell me anything. These new “basketball positions” Alagappan has suggested aren’t really new; most people with some knowledge about basketball know all players have various tendencies even as they’re one of five guys on the court. For instance, small forwards range from ball-handlers, defensive stoppers, 3-point specialists, and slashers. Anyone can watch a few basketball games or play a few games of NBA 2K12 and figure them out.
Also, 4 of his 13 positions are quantitative (based on productivity) rather than qualitative, which makes them particularly useless. Should I really be surprised that my team should aim to get and pay max contracts for “one-of-a-kind” players rather than on glorified role players? Stats might help me figure out the difference between an NBA 2nd-Teamer and a 1st-Teamer, but statistical tools, like John Hollinger’s PER are already out there.
Finally, how is LeBron not “one-of-a-kind?” I dislike the guy, but I don’t see how Rose is “one-of-a-kind” and LeBron isn’t. And Caron Butler hasn’t been anything close to “NBA 2nd-Teamer” in years.
Nodes are players, but what is an edge? That is, when are two players linked by a common edge?
Nodes are groups of players and an edge between two nodes indicates that the nodes share a player.
My guess is that the presenter did develop a useful way to translate quantitative statistical categories and chart them against each other, and use the clustering of results to redefine multiple new player types. Perhaps the data and the use of data is there, but it falls apart in visualization and especially as a stand alone power point.
Great read on NYT on the presentation http://offthedribble.blogs.nytimes.com/2012/03/06/trading-small-forward-for-scoring-rebounder/#
As mentioned in his slides, the presenter works for a Silicon Valley data analytics company called Ayasdi:
http://www.ayasdi.com/
In which world can we get a metric, where Rajan Rondo is a role player!?
Wow…that Celtics example really fell apart, huh? Goes to show you this guy doesn’t know as much as he think he does…It’s too bad the ideas at Stanford don’t map to what really happens. Why isn’t Kevin Love the top scoring-rebounder? I think everyone knows he is the best scoring rebounder in the NBA. Try again, California.