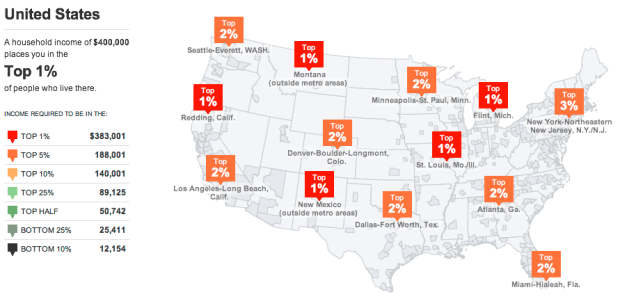
Accompanying an article on the variations of the wealthiest one percent, The New York Times provides this interactive map to see what percent you’re in. Simply enter your household income and see how you compare in metropolitan areas with over 50,000 households.
Nation-wide, a household income over $383,000 puts you in the top one percent. However, a lower household income of $179,000 puts you in the top one percent in Flint, Michigan. The same wage in San Diego, California puts you only in the top eight percent.
Also: what jobs the top one percent have.
Update: There was also a fine print version.
 Visualize This: The FlowingData Guide to Design, Visualization, and Statistics (2nd Edition)
I love seeing the regional variation in data like these. A great addition would be to incorporate interregional price indexes to not only see where a household fits in its metro area income distribution, but also how its income compares to a similar income in another metro area (in real terms, adjusted for regional price differences).
Another interesting look at regional variation of incomes is here: http://www.theatlanticcities.com/jobs-and-economy/2011/10/where-one-percent-live/393/
Does anyone know what js library/other tech the NYTimes uses to enable these graphics in IE8? I see they use for newer browsers…
*I see they use canvas for newer browsers…
Probably a lot of custom code, but it looks like they started with the open source JS mapping library Leaflet:
http://leaflet.cloudmade.com/
Can’t speak to what is going on here specifically, but Jeremy White (who led this one) has talked about inserting bits of Flash when more newfangled things aren’t supported. It looks like some of that could be happening, judging by a glance at his code here.
Another interactive / statistics map that fails to recognise the existence of Hawaii and Alaska. *mutters on about the mainland conspiracy*
I noticed that lack of HI and AK too. Seems kind of an oversight.
Where did they get the data from? Income, shapefiles, etc. Any links on that?
Pedantry time. :-) Both the article and the interactive graphic seem to muddy the important distinction between “income” and “wealth” (i.e., net worth).
Again an issue about color. Color blindness is always an issue (especially using a red-green scale). But what bugs me more is the connotation about the colors. Red is usually considered ‘negative’ and green ‘positive’. This is (intentionally) conveying that more income is a negative thing. I’d rather a blue-green scale or a tint/shade scale on green only.
I know this blog is about data visualisation, not global economics, but I can’t resist pointing readers to a (admittedly less visually impressive) resource that puts one’s relative earnings into a global, rather than US, perspective. A lot more readers will be in or approaching the 1% globally! Here it is: http://www.givingwhatwecan.org/resources/how-rich-you-are.php
Another point to make is the source of their data is the IRS. That ‘top 1%’ is top 1% of tax filings. That creates all sorts of data issues, including the fact that 49% of all Americans do not pay income tax, although it is not clear how many of that 49% have to file. A significant number do not.
It also creates the difficulty of numbers…some filings represent one person’s earnings. Some represent two. Some represent even more. It also can confuse business with personal income, a lot of the top tier are really businesses that chose to structure themselves as LLCs or S-corps rather than C-corps. Is there any real reason that some business income is excluded from this and some included? Makes a huge difference when talking about the top 1% tail. If someone owns 100% of a S-Corp, corporate earnings are included, if someone owns 100% of a C-corp corporate earnings are excluded, or limited to salary/dividends. While that matters to the IRS, it is irrelevant for ostensible purpose here of understanding distributions of income and wealth.
I think the subject of understanding the wealth and income (two different things) distributions in America is an interesting and worthy topic…but it has not been done. This pretends it has.