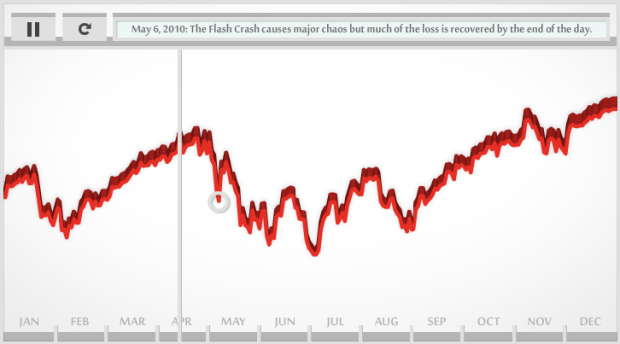
CNNMoney audiolizes the stock market in 2010 with the Dow Piano. Each day’s closing level determines the pitch played, and trading volume determines how loudly a note is played. Welcome to Dow Jones the musical.
[CNNMoney | Thanks, Dominique]
CNNMoney audiolizes the stock market in 2010 with the Dow Piano. Each day’s closing level determines the pitch played, and trading volume determines how loudly a note is played. Welcome to Dow Jones the musical.
[CNNMoney | Thanks, Dominique]
 Visualize This: The FlowingData Guide to Design, Visualization, and Statistics (2nd Edition)
New tools, refined process.
As visualizing – auralizaing? – goes, it suffers from not really making a distinction between ups and downs, which surely is the thing most of us look for in a stock chart?
Doesn’t sound like a hit to me, yet some make billions out of it.
Believe it or not, but I did this exact same thing for a high school math/computer fair back in 1999.
Pingback: The Dow Piano audiolizes the stock market in 2010 « tbellis.org
I think examining relationships between various points and assigning them to intervals might be interesting. Good data source nonetheless. Also having a linear relationship, like sending through a disklavier might be interesting.
Pingback: Dow Piano - Don't Say That
I prepared a similar visualization for a revision control system: