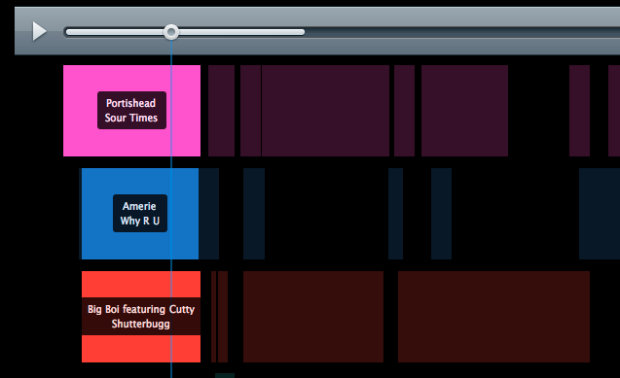
In case you missed it, Girl Talk recently released his fifth album All Day, which samples from 372 songs. Essentially, it’s an album of mashups, so together, samples from multiple songs combine to make a single song. @brahn shows what samples are playing at any given time as you listen to the album. Press play, and the current samples highlight.
Girl Talk mashup breakdown visualized
2 Comments
Second Edition
 Visualize This: The FlowingData Guide to Design, Visualization, and Statistics (2nd Edition)
 Visualize This: The FlowingData Guide to Design, Visualization, and Statistics (2nd Edition)
New tools, refined process.
Awesome! Sound and visuals in one chart. Do you know how he did it?
This is pretty slick – I’ve never heard of “Girl Talk” but I was drawn into this for a while.
@Jose – there’s a bit of info on the site – but basically he’s parsing the data from the Wikipedia entry here: http://en.wikipedia.org/wiki/All_Day#Track_listing_and_samples_used (which is clever because then he doesn’t have to maintain any data) and he just maps it to the audio in a little Flex app.
Simple and very effective…