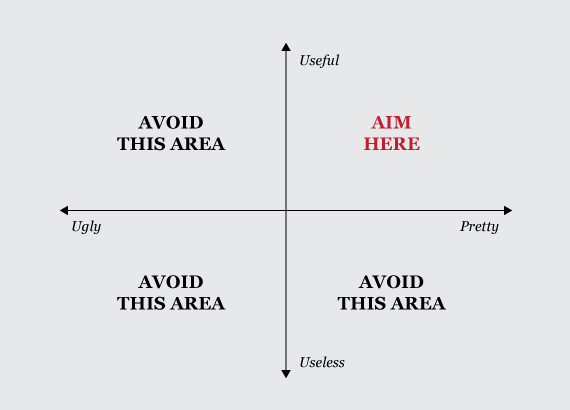
The scales for what qualifies as pretty and useful change depending on the application and purpose, but you always aim for the same quadrant. The best data graphics come from those who are able to find the right balance between aesthetics and utility.
Target for charting excellence
FlowingData Delivered to Your Inbox
10 Comments
Second Edition
 Visualize This: The FlowingData Guide to Design, Visualization, and Statistics (2nd Edition)
 Visualize This: The FlowingData Guide to Design, Visualization, and Statistics (2nd Edition)
New tools, refined process.
Not only the best infographics, as a general rule, the best design at any scale, from tiny logo to architecture to landscape to cities, should aim for that corner. Just sayin’…
Agreed. I’ve found, however, that it’s often fruitful to spend time playfully exploring the ‘useful but ugly’ and ‘pretty but useless’ quadrants as a means of discovering how to create something in the ‘useful and pretty’ sweet spot.
I think the best guidance on this is to consider your audience. This has helped me to understand what they may consider useful and pretty – as these are subjective terms.
This one-line (good) advice does not require a visual at all so it would fit as a data point on the above grid somewhere near the word “Useless” being neither pretty nor ugly. You can check out a long discussion on useful and not-so-useful grids/quadrants at http://bit.ly/c06vZ0
-From a long-time silent fan of this site
This kind of human psyche infographic is brilliant. It’s a great blend of objective/subjective. We liked it so much we’ve posted a short link to it at our website where we’re starting a collection of interesting internet flotsam! And we hope to see more like this. It wouldn’t look out of place in Alan Fletcher’s ‘The Art of Looking Sideways’ which was published by Phaidon in 2001 – check it out if you don’t already know it. x
I’d add a third dimension from “confusing” to “clear” … there’s many pretty and useful graphics that are also unintelligible.
Which would make the graphic difficult to read … I agree with RG that a phrase tells the story clearly without taking up so much room. “Aim for useful, pretty, and clear; avoid useless, ugly and confusing.” There … done … What is missing maybe is a “fun” aspect of this info-graphic.
Pingback: Design Goals – Thoughts On
Pingback: A (pretty) major study of the online world « Dominic Tyer's blog
Pingback: Target for charting excellence | RonJohn.net