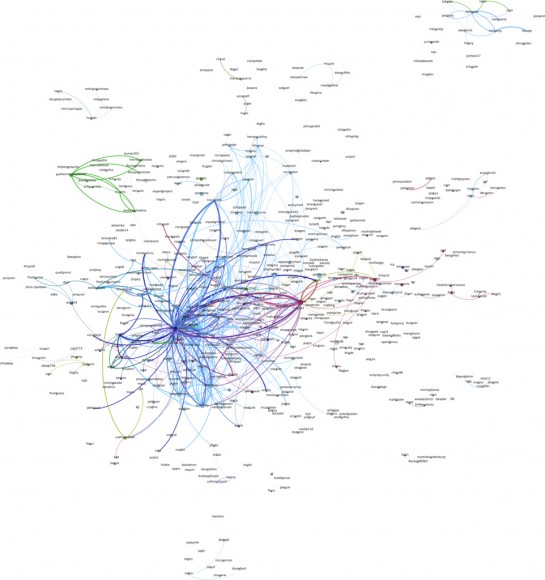
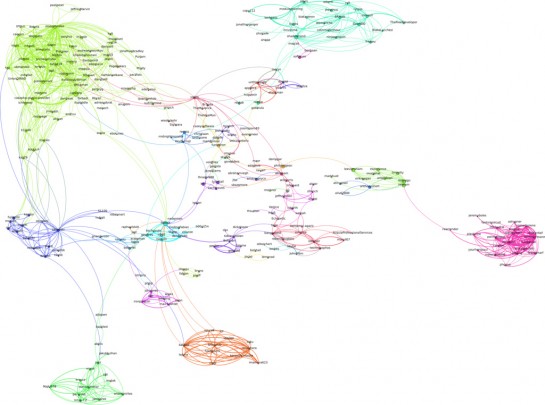
GitHub is a large community where coders can collaborate on software development projects. People check code in and out, make edits, etc. Franck Cuny maps this community (with Gephi), based on information in thousands of user profiles.
The above is a map colored and sorted by the main language of each person (PHP, Python, Perl, Javascript, or Ruby).
Cuny then looks at the structure within the coding networks, which is the most interesting part of the project. The Python map, for example, shows several projects, with Django in the dominant center.
In contrast, the PHP map is a lot more segregated.
I do wish there were some labels for the clusters so that I knew what exactly I was looking at, but if you like, you can download the the files (bottom of post) and explore them in Gephi yourself. See the rest of the graphs over on Flickr.
[Thanks, Steven]


 Visualize This: The FlowingData Guide to Design, Visualization, and Statistics (2nd Edition)

more great pics nathan! nice work!
Pingback: Easyjet to sell flights from Facebook « V E X E D
Wouldn’t this be much more meaningful if the graphs were overlaid on a world map? Otherwise seems to be so much artwork…
geographic might be useful, but this layout is meaningful too. profiles are positioned by the similarities in projects that the people participate in.
Yeah, who cares about how people collaborate? What we really need is to see their geographical distribution, so we can properly discriminate against people in countries we don’t like.
Pingback: 落园 » 协作关系与复杂网络|专注经济视角下的互联网
Pingback: Graph-View of Collaborative Development At GitHub | JetLib News
Seems like just having a legend would turn this from art into an actual graph.
Legends were created so mapmakers of old could more easily change the language of their maps..It would be better to just put larger clear labels in areas where a language or project is dominant.
I’m really interested to use this graphing software.
Pingback: Mapping GitHub – a network of collaborative coders | @FlowingData « ImJustCreative
Hi
just to inform you that the poster is available in a high resolution here: http://fr.linkfluence.net/posters/ (more informations here http://lumberjaph.net/blog/index.php/2010/04/02/github-poster/)
Pingback: Notional Slurry » links for 2010-04-03
Pingback: Dan Siemon » Canada 3.0 Twitter graph