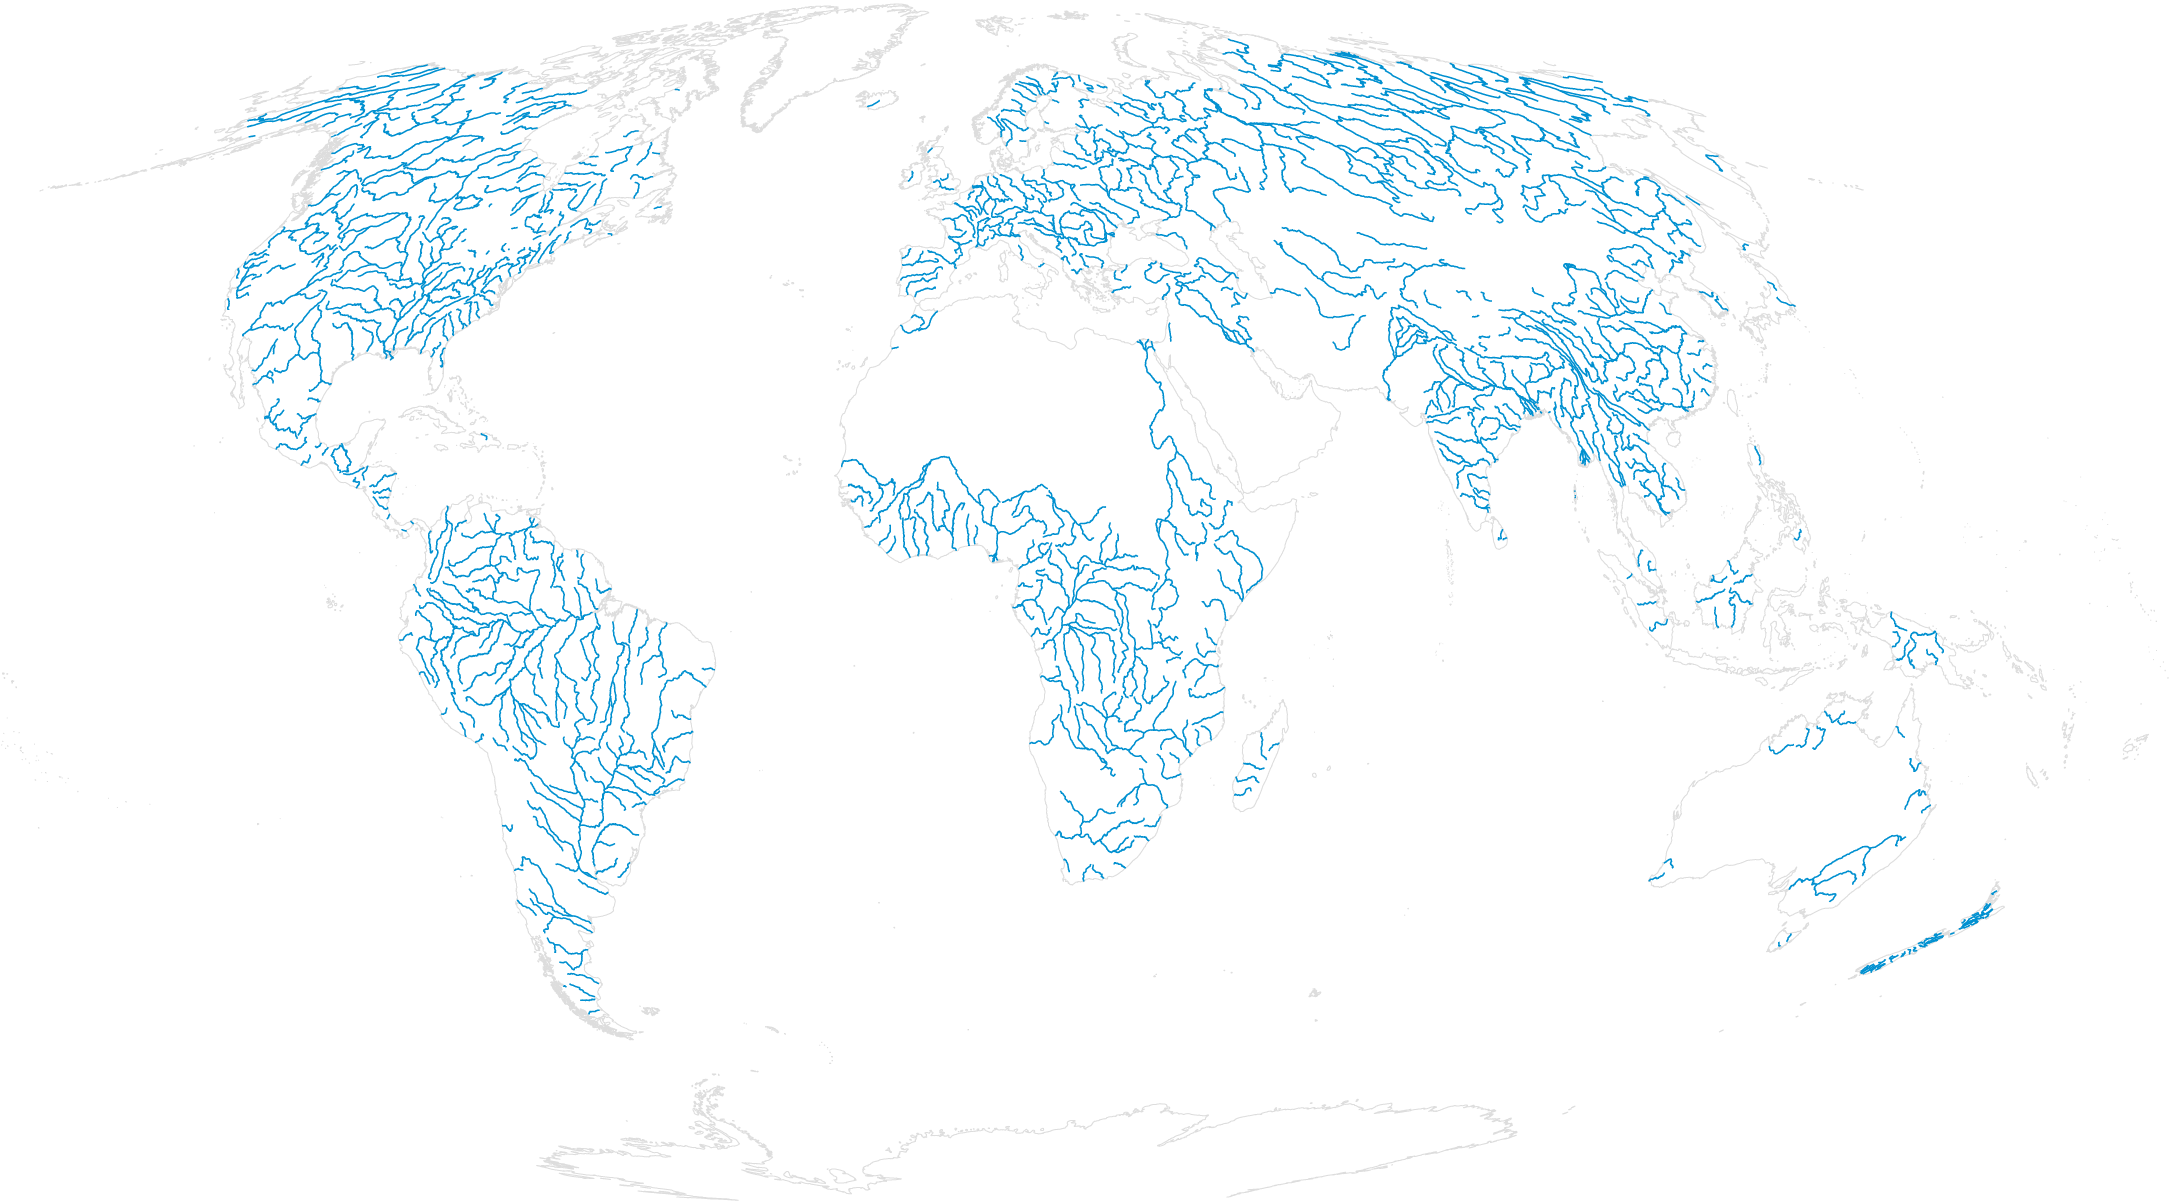
There are various ways to map geographic data in R. You can use specialized packages, and you can use more general ones. You can even use base R straight up (although I wouldn’t recommend it). But if ggplot2 is your graphics package of choice, you can stick with the visual metaphor and syntax and still make beautiful maps. Maarten Lambrechts teaches you how in this course.
Who This Course is For
You want to make maps. You know your way around R and are familiar with ggplot2. This course is for you.
If you prefer to make maps closer to base R, you might want to try this other course.
Recommended Time
One week. Or, fit it all in on a weekend and get back to work.
Learning Objectives
This course covers loading geographical data into R and plugging it into the flexible ggplot2 package for visualization. You’ll map polygon boundaries, points, and lines. You’ll make multiple choropleth maps. You’ll use them as small multiples. Along the way you’ll learn how to work with different map projections, and you’ll even get a glimpse of doing geo-analytics in R.
How to Get the Most Out of This
The best way to work through this course is to have R open and work through the code as you go. Download the source code and data for this course. You can either copy-and-paste from the source download or copy code from the browser.
Pay extra attention to the logic that the code employs and spend less time with specific syntax. You can always look up syntax, but the logic will help you figure out how to work with your own data.
Finally, as you complete each section, try to apply what you learn to your own data. Make maps. They might be ugly at first, but they’ll get better with practice. This is the fastest way to improve your skills.
Your Guide
Maarten Lambrechts is a freelance data journalist and visualization consultant based in Belgium. Maps, both static and interactive ones, are a big part of his work, and R (the tidyverse version) is often involved in making them.
Membership

Become a member on FlowingData to get full access to this course and others, plus hundreds of tutorials and guides. Learn to make any chart, the process of data design, and how to communicate with data.

