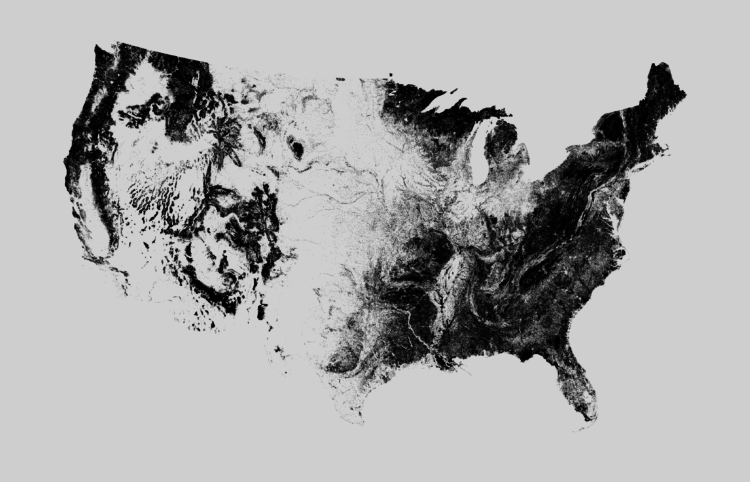
There are many ways to map geographic data in R, and with all the packages available, it can seem like a hodgepodge of items with no clear spot to begin. This doesn’t have to be the case. With a couple of map-specific packages in hand and some clear goals, you can accomplish the bulk of your mapping tasks.
Recommended Time
One week. Or, fit it all in on a weekend and get back to work.
Learning Objectives
Get you making maps that aren’t horrible in as little time as possible. Learn the process, so that you can apply it to your own geographies.
How to Get the Most Out of This
The best way to work through this course is to have R open and work through the code as you go. Download the source code and data for this course. You can either copy-and-paste from the source download or copy code straight from the browser. Or just type it yourself.
Pay extra attention to the logic that the code employs and spend less time with specific syntax. You can always look up the latter, but the former requires some extra effort that works best with actual data.
Finally, as you complete each section, try to apply what you learn to your own data. Make maps. They might be ugly at first, but they’ll get better with practice. This is the fastest way to improve your skills.
Outline
Drawing Boundaries
The borders for geographic regions help make data recognizable, and there are good and bad ways to go about it.
Mapping Locations
Load spatial data and overlay it on the boundaries.
Choropleth Map
Learn to join datasets to geographic regions and then color accordingly.
Making a Lot of Maps
Show changes over both space and time, or make comparisons across categories and subpopulations.

