Visualization
Showing the stories in data through statistics, design, aesthetics, and code.
Election touchscreen really deep dive by The Onion
The Onion gained access to the most granular election data yet. Technology sure…
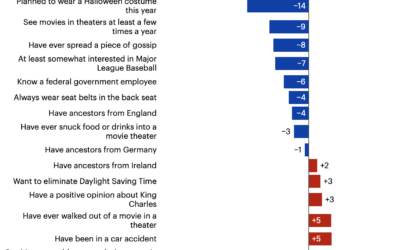
Presidential candidate preferences, by offbeat demographics
You’ve seen the voting tendencies among standard demographic groups, but there is so…
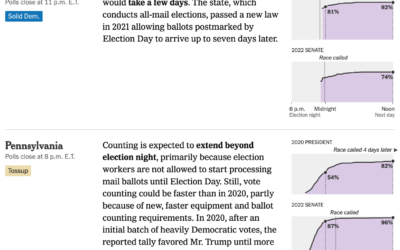
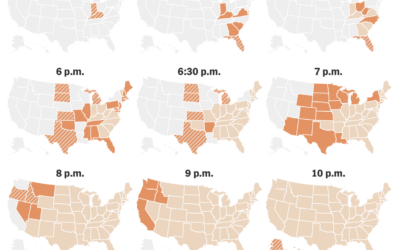
When to expect results from each state, based on previous elections
Some states count quickly, whereas others can take days. For NYT, Alicia Parlapiano…
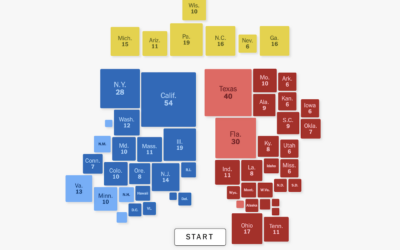
Winning the Electoral College, a mini-game
For The New York Times, Lily Boyce, Jon Huang, and Blacki Migliozzi made…
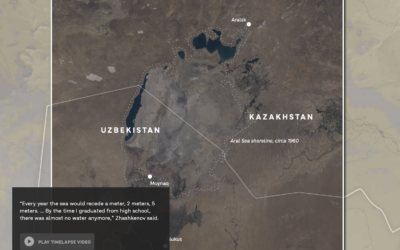
Drying of the Aral Sea and its source rivers
NPR reports on the drying Central Asia water sources. The Aral Sea has…
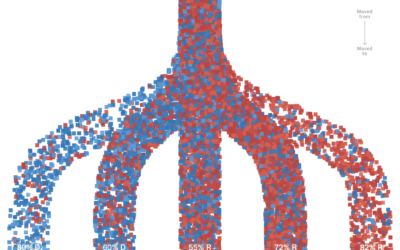
People moving towards political affiliation
For NYT Upshot, Ronda Kaysen and Ethan Singer compared current voter registration data…
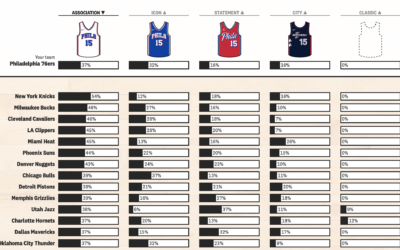
Uniform flair on the rise in NBA basketball games
In NBA basketball, the home team used to almost always wear a white…
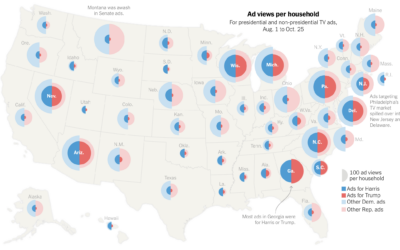
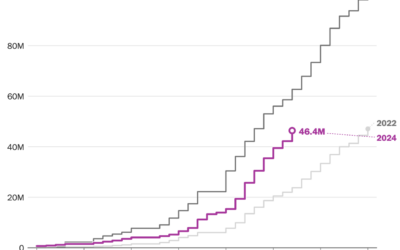
Election ad views for Democrats and Republicans
For NYT Opinion, Gus Wezerek compared ad views per household:
To figure out…
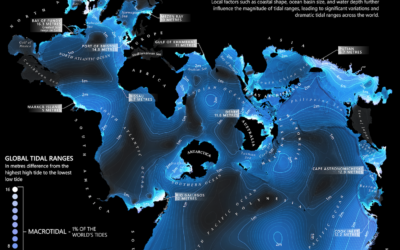
World map of tides
From Dave Taylor, this world map shows tidal ranges, from microtidal to macrotidal:…
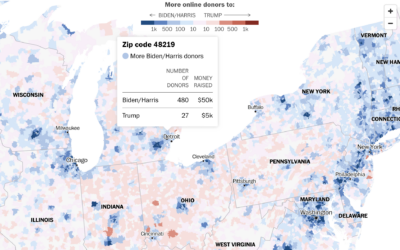
Which campaign people donate more to, by ZIP code
Using a combination of Federal Election Commission filings and voter registration, the Washington…
Micro-communities that might decide the election
For NYT Opinion, Patrick Ruffini, with graphics by Quoctrung Bui and Aileen Clarke,…
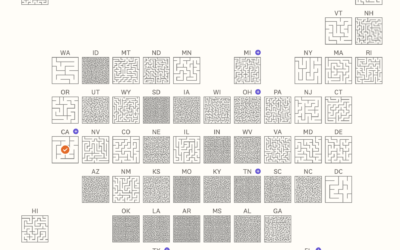
Abortion mazes to represent the complexity of abortion access
Speaking of grid maps and abortion access, Jan Diehm and Michelle Pera-McGhee, for…
Legality of abortion pills in each state
For the Washington Post, N. Kirkpatrick and Szu Yu Chen describe the legality…
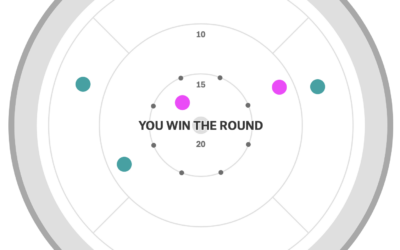
Visual explainer for the thrilling game of Crokinole
From Russell Samora for The Pudding, “Crokinole is like a mashup of shuffleboard…
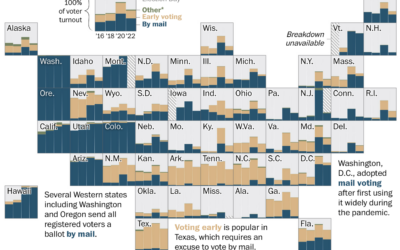
How Americans vote in each state
Some states have almost completely moved to voting by mail or early voting,…
Scale of buildings destroyed in Gaza
Damage assessments from UNOSAT estimate that 66% of structures in Gaza are damaged…


