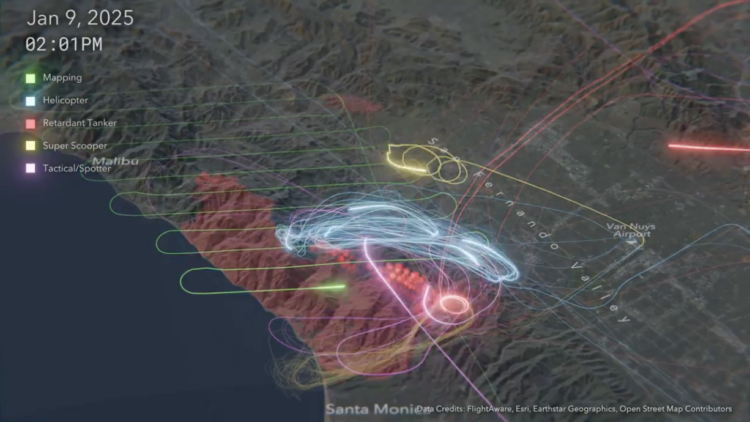
To contain the fires in Los Angeles, aircraft flew back and forth to drop retardant and survey the area for several days. Peter Atwood used an animated map to show 24 hours of activity, totaling over 15,000 flight miles.
Atwood used wildfire data from NASA, the ArcGIS Living Atlas for terrain, and FlightAware data for the flights. The neon aesthetic highlights the patterns and urgency of each aircraft’s travels.
 Visualize This: The FlowingData Guide to Design, Visualization, and Statistics (2nd Edition)