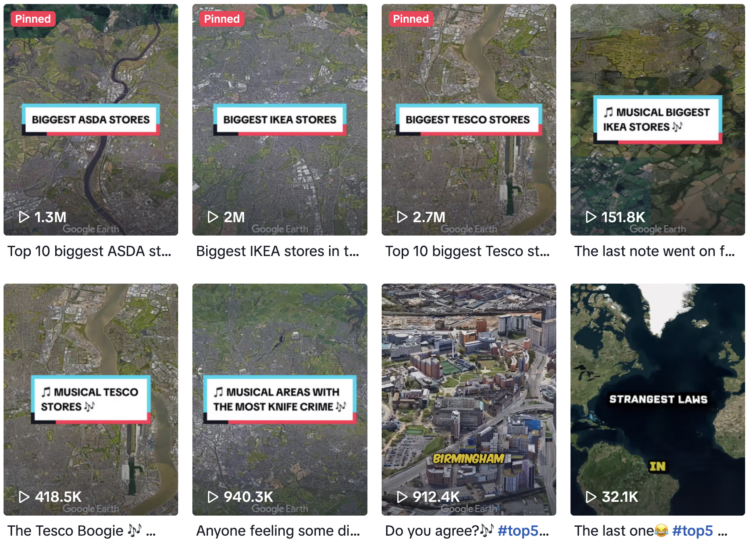
The TikTok account Globetrots combines Google Earth and text-to-speech to show top-ten lists with various statistics. For example, what cities in the United Kingdom have the most people on benefits? A Google Earth shot pans to the different cities as text-to-speech narrates.
A good number of their videos have gained popularity (or the TikTok algorithms are pushing novelty). And the account recently subbed text-to-speech for a song format, which I think uses TikTok’s AI song feature? Just watch:
It’s really corny, but we might also be seeing the beginning of something.
 Visualize This: The FlowingData Guide to Design, Visualization, and Statistics (2nd Edition)