Data wrangling — formatting and cleaning — is a sore spot and stumbling block for many, but you often can’t do much visualization- or analysis-wise until the data is in order. My projects folder is filled with one-off Python scripts written for specific datasets (and steps within steps).
Trifacta Wrangler aims to streamline the process with a click interface and automation. The desktop software is free to use and available for PC and Mac.
When you open the application for the first time, helpful tips pop up to take you through the usual steps. Load a dataset, and it tries to figure out the format on its own, defining columns as text, numeric, binary, or something else among the ten or so categories.

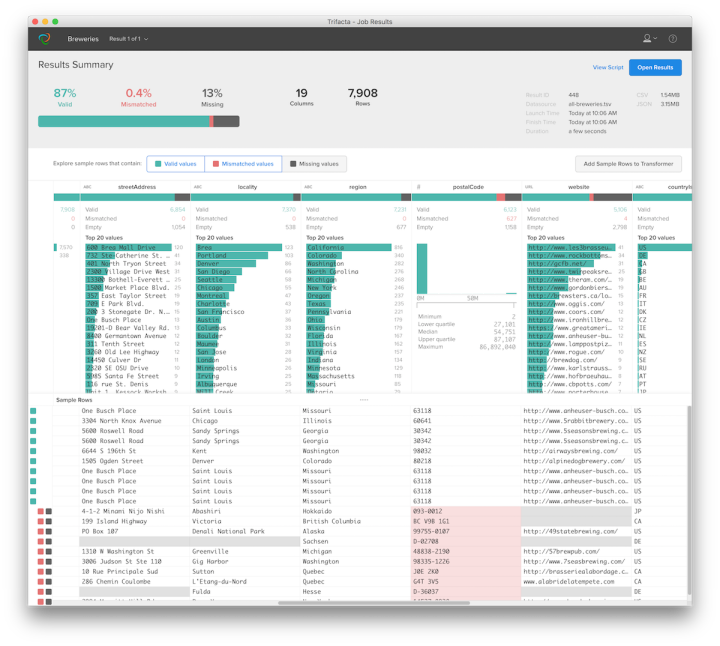
Then you get a view that resembles the above. It’s a visual summary of the dataset. Again, this is focused on wrangling and the very initial steps of analysis, so it shows stuff like percentage of missing values or columns that seem to have mismatched formats.
This worked well for my dataset with little help from me. I really like the view as a way to take inventory of what’s there.
Then you can use the Transformer to modify the data. Admittedly, I got lost during my first pass. There’s a script generator so that you can reproduce results, and you can manually edit the script to get your data just so. I’ll have to play around with this some more.
All in all, at first look, Wrangler (still in Beta by the way) looks promising. Honestly, I’m so used to writing one-off scripts that I might never get to using it more extensively, but I’ll keep it in the toolbox.

