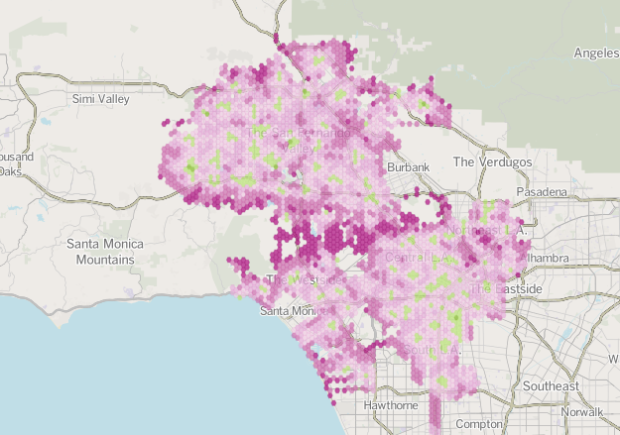
Ben Welsh, Robert Lopez, and Kate Linthicum for the Los Angeles Times analyzed more than a million runs by the Los Angeles Fire Department to estimate response times, based on where you live. The national standard is six minutes. The map shows average response times that are greater in red and those that are under in green (basically, anywhere there is a fire department).
The lead-in mentions that LAFD leaders have said that they routinely fail to meet the national standard, but if you’ve driven in Los Angeles, it’s not hard to imagine why it takes those extra minutes. I wonder how this compares to other high-traffic cities.


More to the point, the LA City Council agreed to shutter numerous fire stations after LAFD gave them flawed data on how well they were meeting the response times. Apparently LAFD submitted results of their predictions of response times, not historical data. From the article, “The Fire Department’s 911 response record is being closely scrutinized by auditors, fire commissioners and elected officials. In March, top commanders acknowledged the agency had for years been producing performance reports that overstated how quickly rescuers were reaching victims in need.”
A big issue here is the actual responses depend on the other calls in the queue at the moment a call comes in. A model predicting drive time from the nearest station (even accounting for hills and traffic) would grossly under-estimate time if that station and other nearby stations are engaged.
The areas with the largest response times correspond to areas which have houses high in the Santa Monica mountains. Driving up those hilly roads takes a lot of time.
ThePig makes an excellent point. Looking at the overall volume in these areas reveals that the call volume there is very low. While on an averages basis this looks like poor coverage, the reality is that providing a 6 minute response time to these areas would require an unfeasible number of stations. One would be able to get a far clearer picture if the map were normalized by population or call volume, and/or looking at the number/percentage of over-goal calls rather than the actual response time.