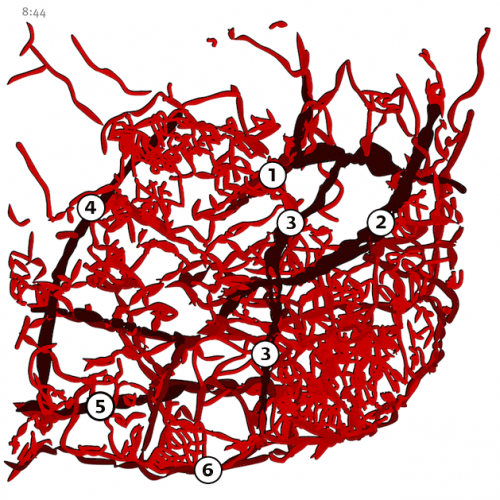
Pedro Cruz puts a twist on the traditional map approach to visualize traffic in Lisbon as blood vessels:
In this work the traffic of Lisbon is portrayed exploring metaphors of living organisms with circulatory problems. Rather than being an aesthetic essay or a set of decorative artifacts, my approach focuses on synthesizing and conveying meaning through data portrayal.
Vessels swell and wiggle as traffic picks up during the rush hour and then relax and shrink as traffic goes down. More useful than an actual map? Probably not. Fun and engaging? Yes. Catch the short animation below.
[Visualization et al | Thanks, Pedro]


I remember a story a few years back on NPR about researchers studying how blood cells move through our circulatory system as a way to better model and understand the flow of traffic.