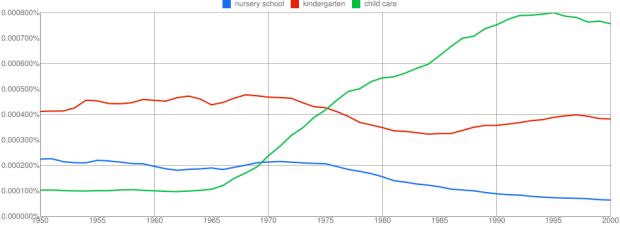
Language changes. Culture changes. And we can see some of these changes via what authors write about in books over the years. Google’s Book Ngram Viewer lets you search through this data, and shows a graph similar similar to the output of Google Trends. The above is the trends for nursery school, kindergarten, and child care:
This shows trends in three ngrams from 1950 to 2000: “nursery school” (a 2-gram or bigram), “kindergarten” (a 1-gram or unigram), and “child care” (another bigram). What the y-axis shows is this: of all the bigrams contained in our sample of books written in English and published in the United States, what percentage of them are “nursery school” or “child care”? Of all the unigrams, what percentage of them are “kindergarten”? Here, you can see that use of the phrase “child care” started to rise in the late 1960s, overtaking “nursery school” around 1970 and then “kindergarten” around 1973. It peaked shortly after 1990 and has been falling steadily since.
Find anything interesting?
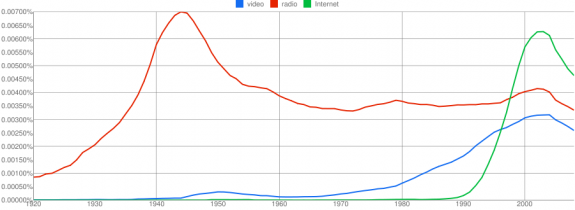
Here’s a search for video, radio, and internet. I think there’s something to this Internet fad:
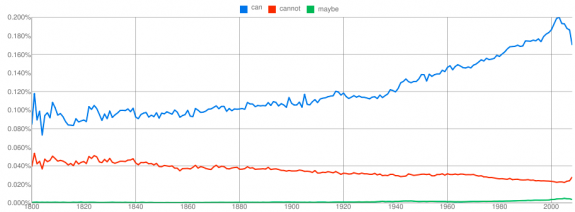
Here’s a search for can, cannot, and maybe:
The more notable part of this launch is perhaps that all of the data backing the Ngram Viewer is available for download so that you can run your own experiments.
[Books Ngram Viewer | Thanks, @mattorantimatt and Michael]


Pingback: Ngrams: when Statistics overtook Mathematics « Robin Ryder's blog
A modern-times overtaking of geekery over nerdiness:
http://goo.gl/rF422
I’d like to note that both geek & nerd have over taken jock! FTW!!
http://ngrams.googlelabs.com/graph?content=nerd%2Cgeek%2Cjock&year_start=1980&year_end=2008&corpus=0&smoothing=2
We win :)
Hi Nathan. Really enjoying your posts and twitters – thank. I’d originally spotted this service through David Pogue’s twitter re the NYT story.
I had a little play using one of my client’s names – the Duchess of Rutland. Take a look at this historical graph from 1750 to 2010 – http://bit.ly/f5EuRr. It’s a great service for modern day trends – and historical relevance.
I asked the Castle’s archivist about it (he likes the service). He said:-
<> The modern day uplift is that my client has recently written a book.
Keep up the good work – you’re blog is the most in touch with visualisation that I’ve found.
Just tried another one – sorry … historical and British! Comparision on Ducal homes – http://bit.ly/fW3LPl – it tracks the change in influence politically and modern day transition to tourist attractions! P
Concerning your second example, there is a slight mistake that distorts the graph.
Instead of Internet you have entered internet. The search is canse sensitive, however, which omits most mentions of the new medium.
Below the link to a corrected version:
http://ngrams.googlelabs.com/graph?content=video,radio,Internet&year_start=1920&year_end=2008&corpus=0&smoothing=3
Here we see the expected peak and the Internet has indeed surpassed the other two types of media.
Thanks, Ranjit.
I had fun with this a few days ago. Made a few little discoveries: http://halfblog.net/36791741
Pingback: Jumping on the Google Ngram Train: Cooperation vs. Conflict « haba na haba
On the first graph, if you add “childcare” as a unigram you’ll see it’s been steadily increasing even as “child care” has been decreasing.
I’m wondering which are the most popular n-grams for each language. Is there a way to know without downloading all the datasets?
Proving finally that the amount of happiness is negatively correlated to the number of pants: http://bit.ly/esO7ej
I’ve done a few searches related to my work (fundraising analytics):
http://wp.me/pJgUs-p6
– database vs. data base
– philanthropy through the ages
– poverty vs. religion vs. education
– data mining, fund raising and fundraising
Horse vs. Car
http://ngrams.googlelabs.com/graph?content=horse%2Ccar&year_start=1800&year_end=2000&corpus=0&smoothing=2
Pingback: Ngrams and Human Rights | P.A.P.-BLOG – HUMAN RIGHTS ETC.
Exposes some of the limitations of the OCR software. Search for “hitler” for example, and references in the 19th century are higher than the 20th. Looking at some page scans, they seem actually to be words like “latter” or “hiller”. Searching for “Hitler” though gives the results you would expect.
I see the same issue for Russian corpus. If you search for public enemy (враг народа), you see significant frequencies in 2000-ies, while it is hard to give logical explanation to this phenomenon. I suppose that it is not only OCR-related problem, but also strange biased way to compute frequency distribution of the ngrams
A rather nice implementation, and they get bonus points for releasing the ngram files.
If you read the paper that accompanied the release, they don’t cite any prior work in visualizing/analyzing historical term usage in a text corpus and there is quite a bit, for example:
i.e. Batchelor MT, Henry BI, Watt SD: Who cares what’s new? Nature 1997, 387(6631): 337.
That’s rather bad form.
Pingback: Word Trends « Katelyn M. Thompson's Blog