It’s finally here. Indiemapper brings easy and flexible thematic mapping online. I’ve been looking forward to this app ever since I got a glimpse of what was to come over a year ago, through the eyes of Indieprojector. The guys at Axis Maps have taken the core functionality of advanced GIS, simplified the work flow with a well-designed interface, and made it it super easy to create beautiful maps.
Watch the clip below for a quick idea of what you can do:
While similar applications like SpatialKey are aimed at business intelligence and interaction, indiemapper is built for cartographers slash designers who want to make static maps. I’ve been following the blogs of the two developers Andy Woodruff and Zach Johnson for some time, and they know what they’re talking about.
Features
Indiemapper is kind of like an Adobe Illustrator for maps online. Load your data, pick the features of focus, and then map it. You have several options to choose from (12, to be exact). I won’t get into every one of them, but the main ones like choropleth, proportional symbols, and dot density, are there. You’ve got (non-continuous) cartograms available too:
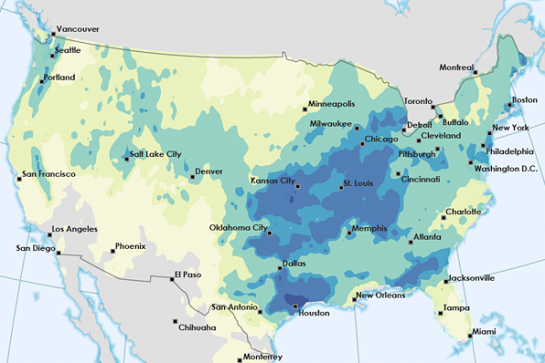
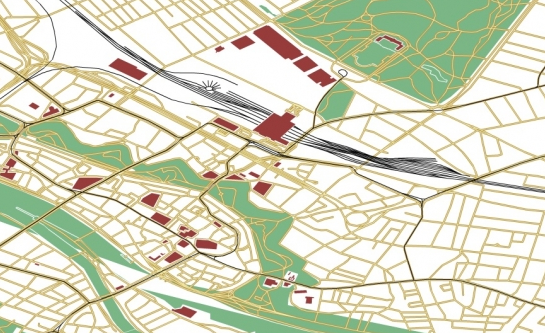
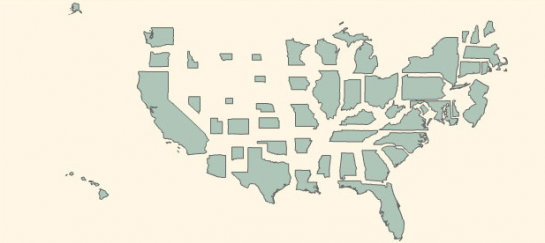
Once you’ve built your map, you can select color schemes ala ColorBrewer, modify borders, label regions, or add more data sources if you like.
The two features that make indiemapper most useful to me though is the ability to easily change map projections and export the map as a layered SVG file. No longer will you get comments from cartographers scolding you for using the wrong projection (I didn’t want to use Mercator every time, I swear). And of course the SVG export lets you make a base map in indiemapper and then bring it into Illustrator for further editing.
A Quick Example
For a quick example, I grabbed a shapefile from GeoCommons on Internet perpetrators per capita in 2007 and here’s what I got in about five minutes of messing around.
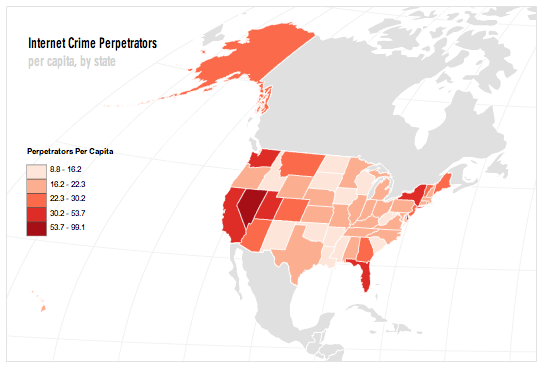
Just for kicks, I tried a different projection:
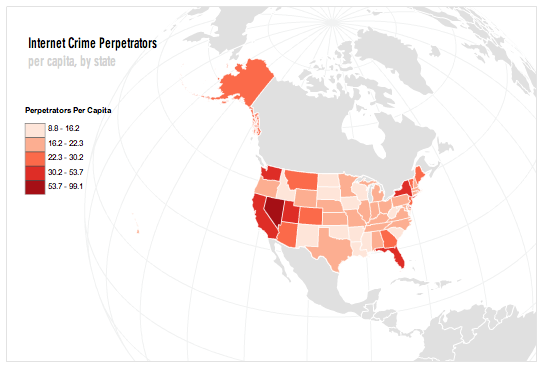
Pretty good, right? Don’t worry if you’re not familiar with projections. There are easy-to-understand explanations for each one to help you choose what works best for your data.
Caveats
All that said, there are a few areas where indiemapper could improve that would really put the app over the top.
The first and most important is data type. Like I said earlier, Indiemapper only accepts shapefiles, KML, and GPX. These are your standard GIS file types, which make it easy to do all that stuff with projections and coloring. They essentially connect data to regions. You need that. But most of us deal in CSV, tab-delimited, etc. I’m betting most of you have probably never even dealt with (or heard of) a shapefile before. There are ways to deal with this, but they can be labor-intensive. I’ve been assured that CSV support is coming though.
Second: because indiemapper is all in your browser (implemented in Flash), the app can drag at times if you’re dealing with big-ish datasets (like bigger than 20mb). I tried a 150mb shapefile that I pulled from data.gov, and that didn’t go so well. Although, I haven’t tried that in something like ArcGIS, so I can’t really say how it compares.
Speaking of which, indiemapper is all about stripping excess, and making core functionality super easy, so GIS power users might be turned off if you’re looking for more advanced stuff like smoothing, interpolation, or geocoding. Basically, you have to do all your data handling and processing with some other tool before you bring it in to indiemapper.
Overall
At $30 per month ($20 for those in education), you’re getting a quality service. You get unlimited data storage, version control, map sharing and collaboration, and most importantly, pretty maps. While there are a lot of free options available, none come to mind that work as well as indiemapper, as far as fully customizable maps go. So it’s an in between the no-cost and high-cost GIS tools. Info designers who want to include maps in their graphics will probably find indiemapper especially useful. CSV import will also be a huge plus if they can work that in.
In any case, like all online software these days, there’s a 30-day free trial, so you should try it out for yourself. My suggestion: create an account, grab some data from GeoCommons, and go to town with it. Then come back here and let us know what you think.


Indiemapper gives web-geeks easy access to what are traditionally complex (and expensive) GIS tools. I love it.
My favorite feature is multiple projections — far too many web maps are straight lat/lon grids. Seeing the Earth’s curvature is a pleasant visual break, and really makes these maps stand out, even if some of the other features are lacking.
On my wishlist: I would love to see Indiemapper support direct import from Geocommons and other online datasources.
while that’d be useful, i kinda think that’s outside the scope of what it should be. i think they should focus on making really really great maps, and then leave data handling for somewhere else.
then again, there’s that CSV import, which will inevitable require data handling, so i don’t know.
Yeah, I was thinking that Geocommons already has a lot of SHP & KML files, would be a sweet integration and alternative to Maker. In the meantime the download/upload cycle isn’t too bad.
yeah, there’s definitely something there. what uuorld up to these days, btw?
Pingback: Linkroll for April 28th « Dialogue Earth
Pingback: Indiemapper » YZO
This looks like it could be a useful tool, but it crashes my browser every time I try to make a map – both IE8 and FireFox.
hm, it did okay whenever i ran it. do you have the most recent version of flash?
Hey Hayden, Zach here from Axis Maps. We’d love to get to the bottom of your crashes. You can submit a support request directly within indiemapper, or just shoot an email to [email protected]. It’d be helpful if you can let us know what data and steps led to the crashes. Thanks in advance.
Pingback: Weekly Shared Items – 4. May, 2010 | TOXIN LABS - weblog of a german design student from wuerzburg