It’s Friday. It’s summer. It’s time to relax in the backyard with an ice cold beer in hand. As you consume your beverage, here are 11 infographics about your beer, because the more you know, the more you enjoy. To start things off is a full history of beer (above).
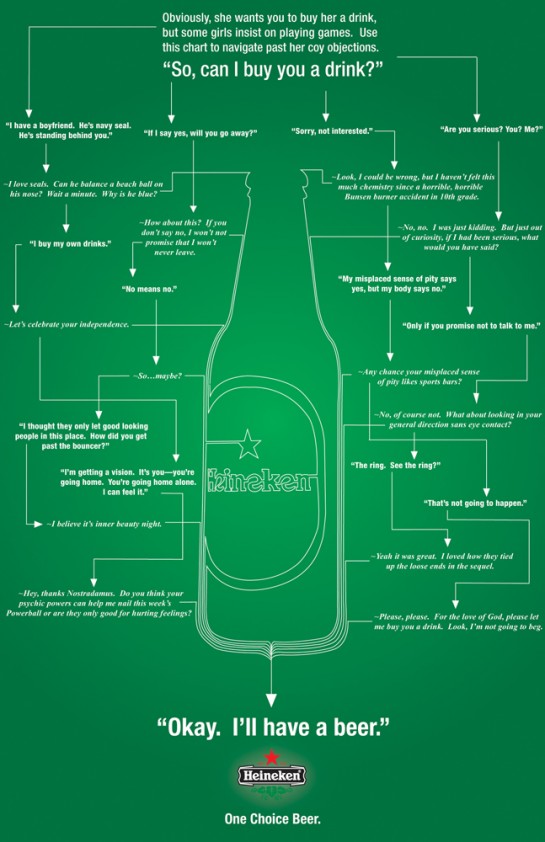
Heineken provides a flow chart if you should buy the lady a drink:
Where is the best beer in America?
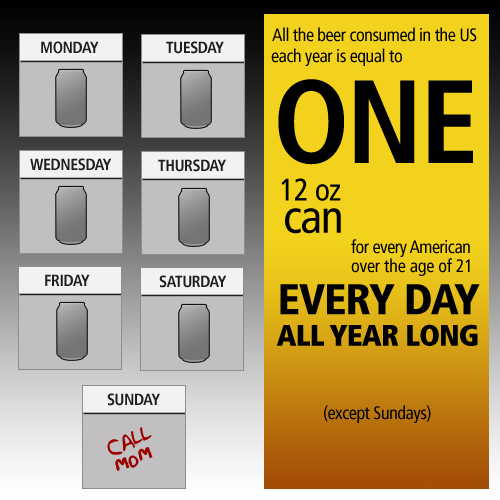
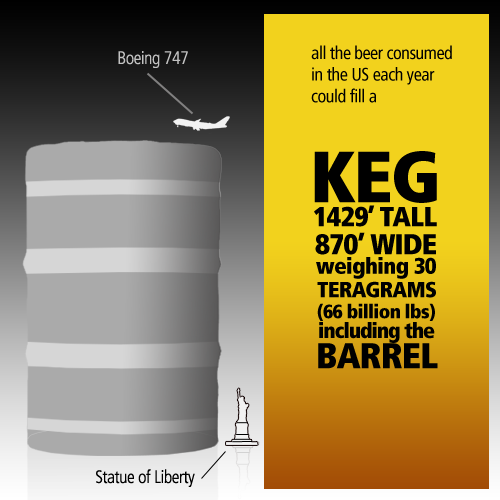
The US consumes 50 billion bottles of beer annually. Jess from Wallstats puts this into perspective. Here are two of a series of eight.
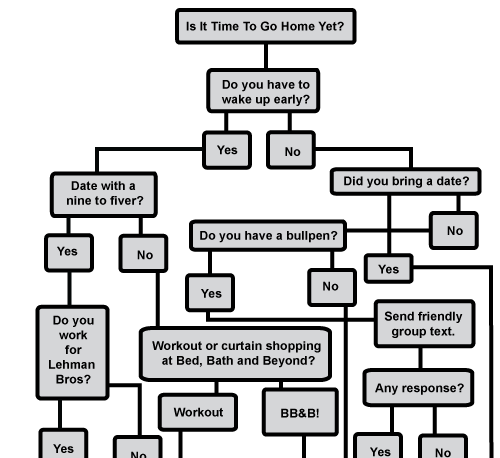
Is it time to leave the bar yet?
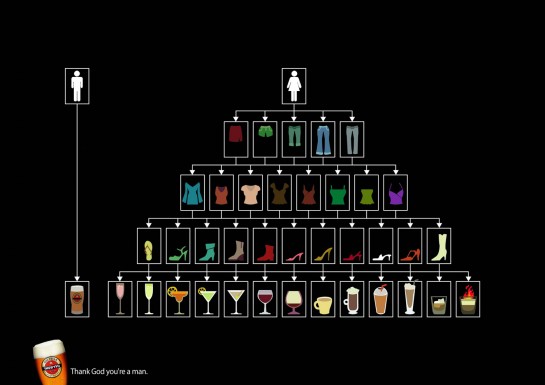
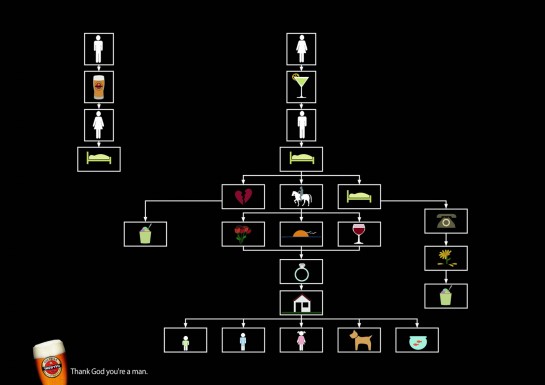
It’s man versus woman in these decision-making flowcharts for Goldstar.

How old do you have to be to drink around the world?
Finally, Budweiser explains drinkability. It’s all so clear to me now.
Enjoy your weekend everyone – along with a frosty pint. By now, I should be on a plane headed back to California for a friend’s wedding. ‘Tis the season for celebrations.




Pingback: The Litmus | The Dapper Alchemist
Pingback: 11 beery infographics : contrarian
Pingback: Linkdump 51 | ettf.net
Pingback: Linkdump 51 | ettf.net
Pingback: Daily Research » Shared Items - June 1, 2009
Pingback: Оттук - оттам 03/06/09 | Ñпанак.орг