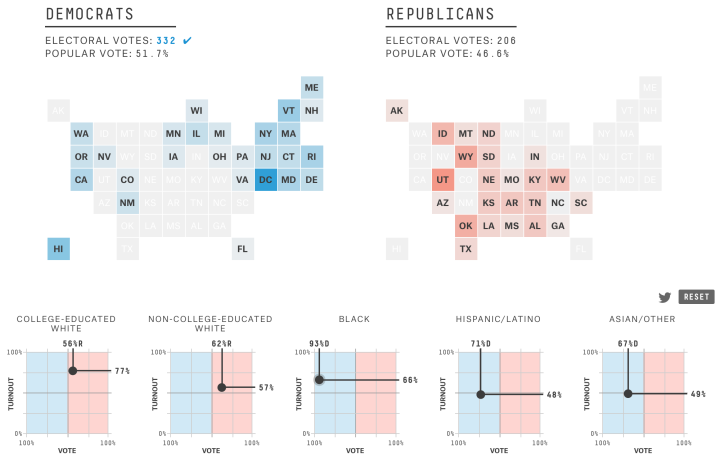
Does your vote matter? Aaron Bycoffe and David Wasserman for FiveThirtyEight provide an interactive that shows what states might switch sides if you changed turnout rate and party preference for various demographic groups.
There’s a dragger on the bottom for each group, where the vertical axis is the turnout rate and the horizontal is party preference. As you click and drag, states move back and forth accordingly.
The transition of states from one side to the other works well in this case, and as a whole, the interactive provides clarity to what I think might seem like a confusing statistical model.
 Visualize This: The FlowingData Guide to Design, Visualization, and Statistics (2nd Edition)