“I wish there was a timeline browser for all the historical events documented on Wikipedia, from the Big Bang up to present,” you thought to yourself. Well look no more. Histography, a final project by Matan Stauber at the Bezalel Academy of Arts and Design, is an interactive timeline that lets you sift through events and eras. It’s updated with new events on the daily.
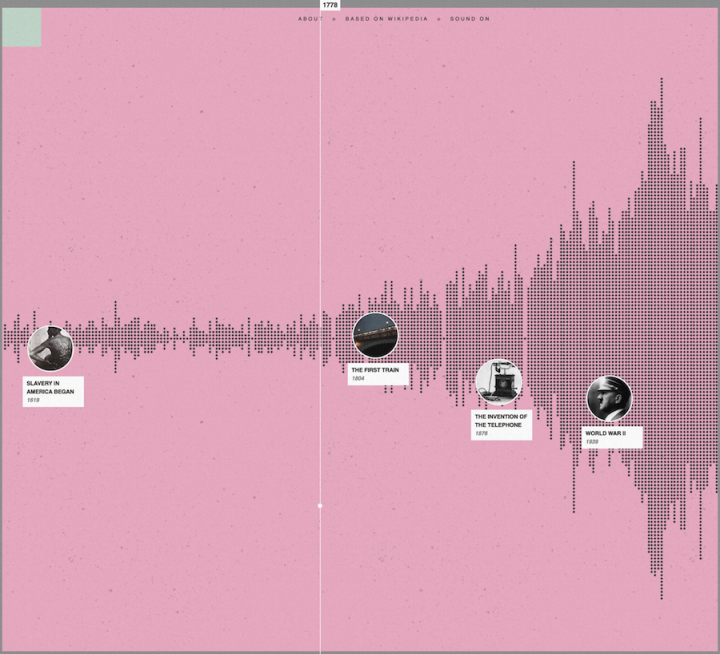
Each dot represents an event, and the horizontal axis represents its place in time. Categories in the left sidebar let you quickly filter to literature, war, inventions, etc. A scrollbar on the bottom highlights specific sections of time, such as the Stone Age, Renaissance, and Industrial Age.
When you filter, the dots that don’t match roll away as if you were working with a table of marbles, further reinforced by the sound of colliding balls.
As with many things Wikipedia data-related, this only accounts for things on Wikipedia and not all things that ever happened in the history of the universe. So naturally, there are more recorded events as you move up to the present.
But with this in mind, this is a fun one to poke at. I want one of those interactive tables with this piece running on it. It’d be the ultimate coffee table book.
 Visualize This: The FlowingData Guide to Design, Visualization, and Statistics (2nd Edition)