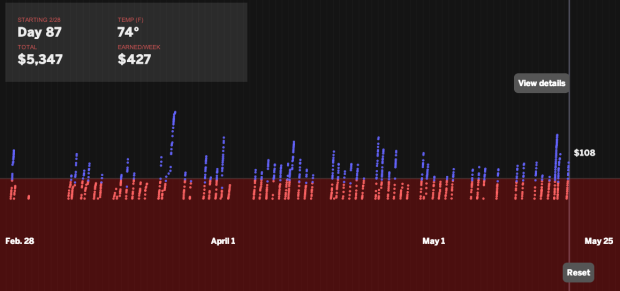
According to the Bureau of Labor Statistics, cab drivers and chauffeurs make a median salary of $22,400 per year, or $10.79 an hour. (I believe that’s not including tips.) Using about three months of fare data from a single driver, Alvin Chang for The Boston Globe showed how a driver makes a living day-to-day.
Time runs left to right, and each column represents fares collected in a day. A driver starts each day in the red when he or she leases a cab for $125, which includes gas, and then works into the blue.
After an animation plays out over a few seconds, you can click to zoom in and see specific fares. I expected to drag left and right once zoom, but the chart just zooms back out. I suspect the interaction is mostly there for people on mobile devices. I also wanted to scrub the vertical line that indicates time to see details for spikes or days no fares were collected.
So there’s still a bit to be desired here, but the data itself is interesting, which makes it worth a look.


 Visualize This: The FlowingData Guide to Design, Visualization, and Statistics (2nd Edition)

The story is sad but even worse than it appears here. This chart omits the number of hours worked each shift. Dan Ariely mentioned in one of his books that cab drivers work longer days when there are fewer fares, which is irrationally the opposite of what economists say they should do — work longer hours on more productive days and fewer hours in the less productive days.
Yeah, in the details section it says 12-hour shifts aren’t unexpected (because it’s the standard lease time on the cab).