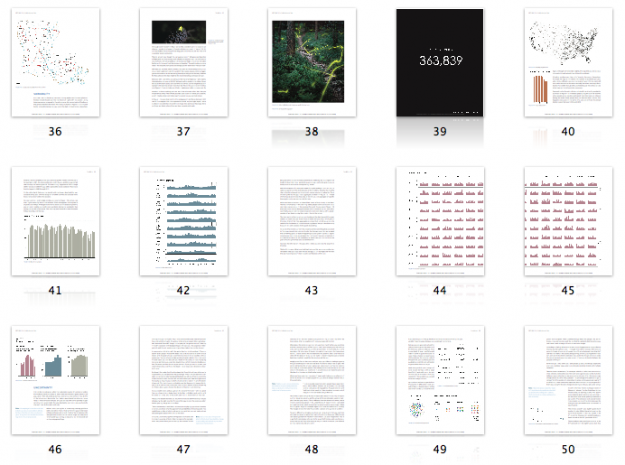
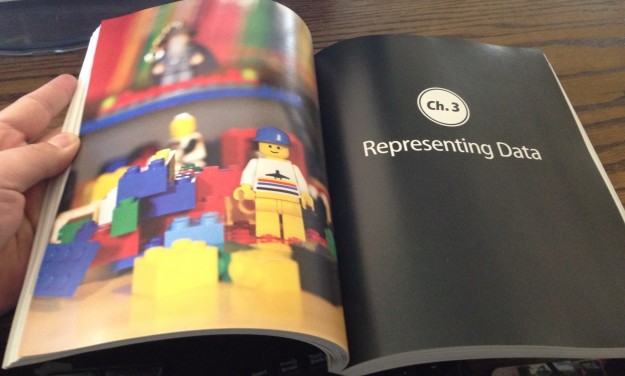
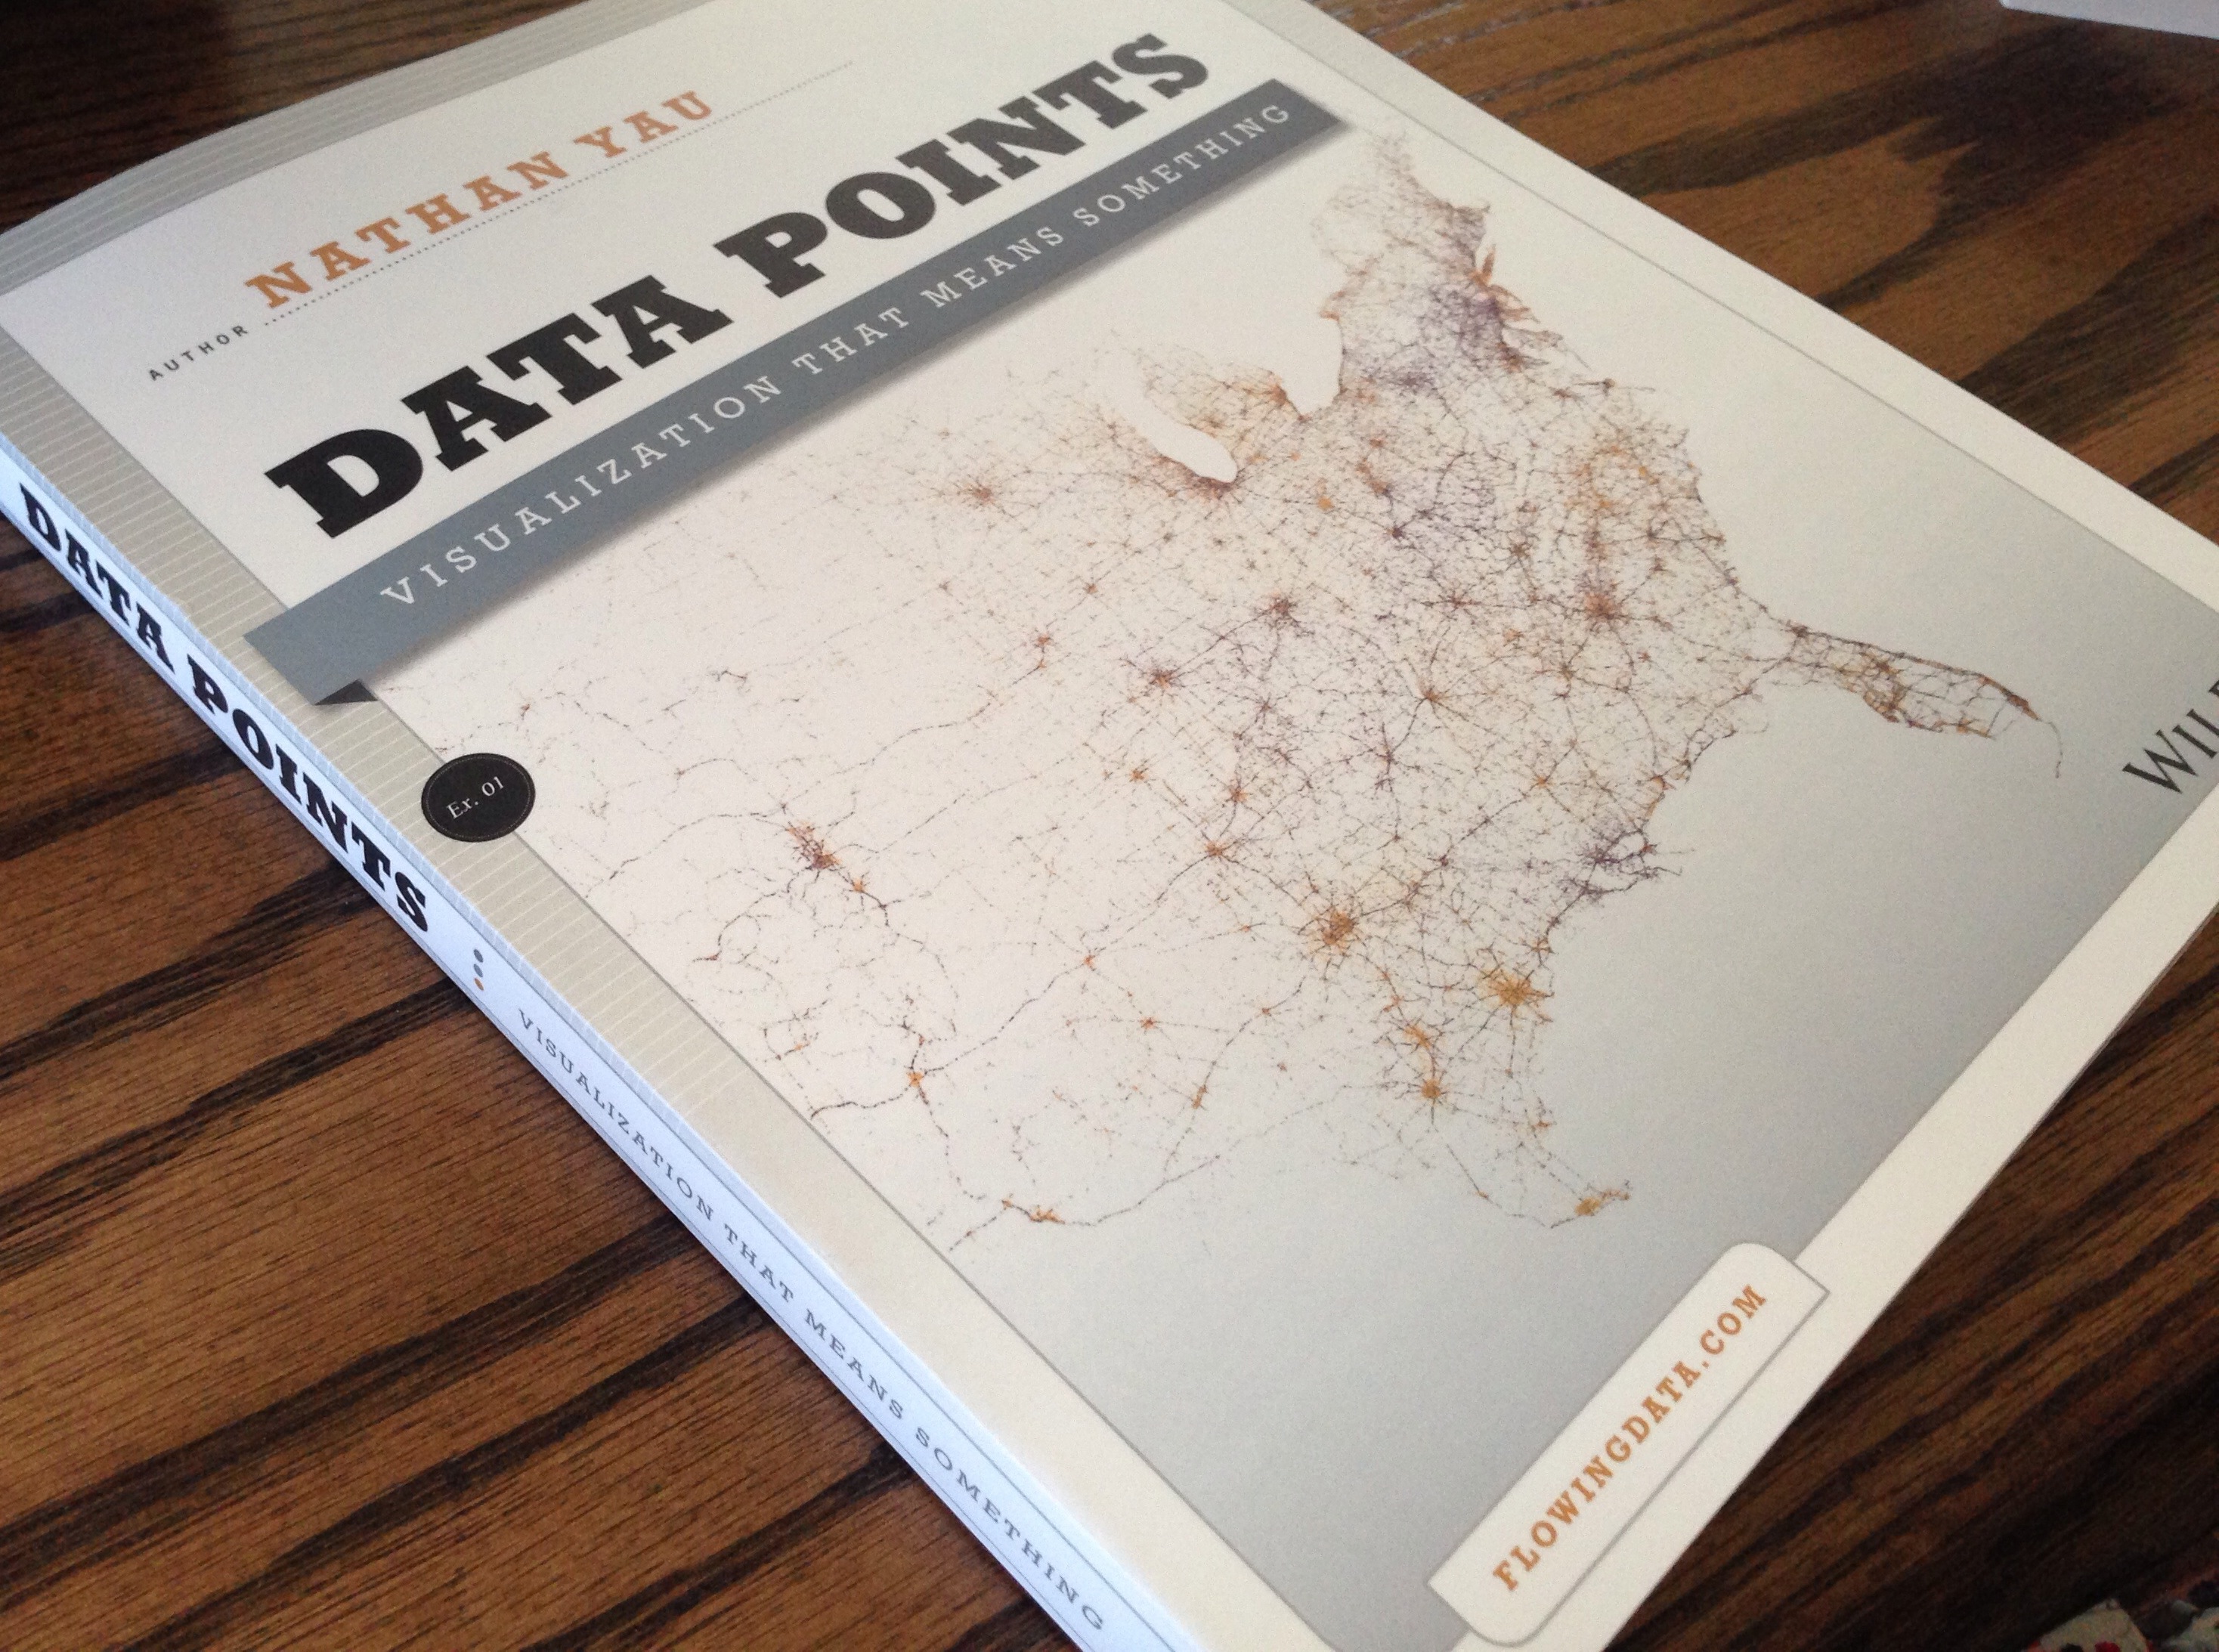
This appeared at my door today. It’s awesome.
I suspect those who pre-ordered Data Points (thanks!) should receive their copies soon.
In the very early stages, when I was figuring out what this book would be about, I had a few directions in mind. I eventually narrowed it down to two: (1) I could go into interaction, kind of like a progression of Visualize This; or (2) A complement to Visualize This that focused on the process of understanding data and visualizing it in a way that is meaningful.
I went with option (2).
I think option (1) would be useful, but the technology (mainly with the Web) changes a lot every day, and I still have a lot to learn in that area, so I don’t think I could give the topic justice. Plus, interactive visualization tends to require relatively more code than the static charts produced in R, which I feel like grows burdensome in print. I like to work through online tutorials (where copy and paste is available) more than I like to read code in a book.
So Data Points is all about process from a non-programming point of view. Start with the data, really understand it, and then go from there. Data Points is about looking at your data from different perspectives and how it relates to real life. Then design accordingly.
There are a lot of examples (and you can get a better idea from the Amazon preview).

The e-book versions are already available, but I highly recommend the print version, if just to see the opening pictures for each chapter that my sister took :).

Pre-order the book here. More to come soon.


Are you familiar with Edward Tufte’s books? Especially “Envisioning Information”? It would be hard to do better than his books. They are for visualization what Knuth’s set is for programming.
Of course :). Tufte approaches visualization from a presentation framework and focuses on design. Data Points approaches visualization as a medium with a wider set of uses and a focus on the data exploration process through the design work which leads to better graphics. This changes your approach to the data.
There’s so much more to visualisation than Tufte.
His books are nice historical showcases, and good coffee-table books for getting people to appreciate that this really is an interesting discipline, but they’re actually pretty thin when it comes to really digging in to usable principles. Nathan’s latest book looks much more useful to a practitioner.
Looks like this book fills a useful niche: basic stats comprehension for visual people and basic visual thinking for stats people. Does that seem like a fair summary?
If so I could see it being a nice compliment to Alberto Cairo’s “The Functional Art” (which I see as, basic journalistic storytelling for visualisation people and basic visualisation for journalistic people).
Ha, this is the funniest comment ever; it’s the equivalent of seeing that he’s written a book on Quantum Mechanics and asking if he’s familiar with Albert Einstein.
Very cool. Can’t wait to get my copy. I wish the Kindle versions of books did a better job with high resolution images. I really like the portability of ebooks but it just doesn’t seem worth the same price as print versions.
Cant wait to get my copy too. agree that Kindle ebook’s image resolution is not satisfactory.
congrats again!
my pre-ordered says its on its way. Very excited.
Looking forward to getting my print copy from Amazon soon… I hope you will consider option (1) for your next book – there are several mature JavaScript-based toolkits for Data Visualization, including (in no particular order) Processing.js, D3, Raphael, and Dojo…
I can understand the reluctance to commit that sort of thing to print – there’s a very high risk of it becoming out of date before it reaches the shops.
If I ran this blog, I’d focus on that sort of thing in the premium side of the blog. That way, having to keep pace with a fast-changing field becomes an advantage and a selling point not a disadvantage.
Hi Nathan,
It looks awesome! I have your first book and have pre-ordered this. Can’t wait for it to arrive :)
Excellent work!
Cheers,
Steve
Thanks guys!
Hi Nathan, the kindle version is useful? I mean do the grpahs lose some quality?
Thanks in advance,
Yep the e-book versions are still useful. I’m just part of that group of people who likes paper books better :).
How good are the graphs quality in the kindle version compared to the paperback? I would love to have the paperback version but the shipping cost outside the us is high.
I pushed for as high-res as possible, and I think the graphics in the Kindle and iPad versions turned out well. (Of course, we had to work within the limitations of the digital formats.)
Just FYI: The book will be available in other countries soon, via physical stores and sites like Amazon.co.uk, so you can save on shipping there.