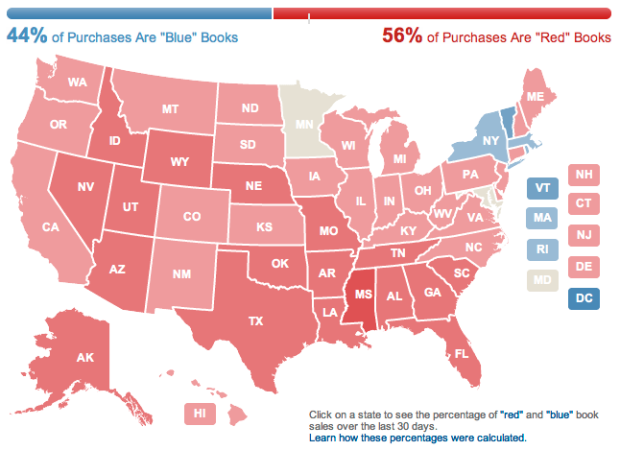
Amazon used their book sales data to color a map red and blue.
Our 2012 Election Heat Map colors each state according to the percentage of red and blue book purchases, based on shipping address, that have been made on Amazon.com during the past 30 days. We take the top-selling political books on Amazon.com and categorize them as “red,” “blue,” or neutral. We classify books as red or blue if they have a political leaning made evident in book promotion material and/or customer classification, such as tags. We compute percentages, updated daily, for each state and the US by comparing the 250 best-selling blue books during the time period against the 250 best-selling red books during the same time period, including new book launches.
The country is practically colored all red, so there’s not a ton to glean from the map. Although I wonder what it’d look like at the county or city level. They should do that. I also wonder what other trends can come from Amazon sales data. They should do that, too.
 Visualize This: The FlowingData Guide to Design, Visualization, and Statistics (2nd Edition)
So…are red people are more likely to buy books confirming their red leanings?
I wonder what the trend would be for people buying politically neutral unbiased non-fiction books, by political leanings?
p.s. did it take anyone else a moment to realise that the tick on the long bar marked half way, and wasn’t a mistake? If only there was some way of visualising simple part-to-whole relationships using a device with obvious, self-evident half-way and quarter points… like, using segments of a circle maybe…
It’s a nice visualization, and clearly shows a segment of the voting population (people who buy books on Amazon). Of course, you don’t need to know how to read in order to vote. This scares me.
Atlas Shrugged Part 2 is coming out as a movie soon – and the book counterpart is a “Red Book”, probably impacts the national trend somewhat, despite the low box office numbers of Part 1. It is in the top 5 book sales for most states I looked at.
I like the graph, but I’d also be interested in coloration for deviation from the mean, as opposed to coloration based on raw percentages. So Maine would be blue on this map (since they buy more blue books than the natl average), for example.
Now, do please forgive me for the sin of being from somewhere other than America, but red and blue mean nothing to me, politically. Don’t you think they should maybe have put some sort of key on the page?
Red = conservative (Republican) Blue = liberal (Democrat) Tan = Middle of the Road Fence Sitter (Independent/Non-Affiliated)
It’s hard to know if this is useful because the content of the books and intent are not apparent. Are blue-leaning people buying red-leanign books because they want to understand their opposites? I bought books on Muslims and the middle east right after 9/11 happened. I assume others did too. It didn’t mean that I was a Muslim or was interested in becoming one.
“The country is practically colored all red, so there’s not a ton to glean from the map…” Huh?!? There’s a ton to glean from it…like–more people buy “red” books than “blue” books…and indeed, statistics show that there are more “conservative leaning people” than “liberal leaning people”. I am not talking about Republican versus Democrat, but what ideology identify with more. So really, this map just confirms that statistic. Agree however that it should be more granular at the city/county level (you will still see more red than blue though–its been done before). The hard cold facts are that highly urbanized areas are more blue than rural, and those dense blue areas also contain the majority of the nation’s population. So what does that say about the bias of the nation’s political leanings?
It would be an interesting experiment to scale the data demographically and compare it to electoral polling data. At first glance, it looks like there’s a reasonable consistency that the most republican states are the most red, so maybe there’s something here worth looking into for predictive power?
eg, perhaps Nevada’s more ‘in play’ than the current lean-Democrat consensus.
I don’t agree with their classification of a number of books, and I think that’s a major issue. What’s leftist about “The God Delusion”? Atheism doesn’t imply liberalism at all.
Yes, it does. Liberals are not known to be religious! In fact that seems to be a tenent of the Democrat Party. You must reject God to be a Democrat. Abortion, gay marriage etc, does any of that sound familiar? LIberals are so unself-aware. Do you even realize the platform of the Democrat Party?
Shauna, there are plenty of religious people with ‘liberal’ views who don’t necessarily subscribe to the dogmatic interpretations of the major religions espoused by many prominent republicans. It’s pretty self-righteous of you to claim they are rejecting God, just your god, maybe.
Likewise there are probably plenty of atheists who have more economically rightwing views, who may vote republican because they feel it’s best for the US economy whilst disagreeing with the platform views on abortion etc. That would be a classic libertarian view.
I think it’s a shame the people of the US have only the two simplistic options of red and blue, as the main parties’ combinations of social and economic policy really don’t represent many peoples views.
Absolutely. Lots of influential figures in modern US conservative thinking are a-religious at best and often anti-New Testament. Ayn Rand’s philosophy, for example (one of the writers in the ‘Red’ list here), is virtually the opposite of the New Testament.
Plenty of branches of Christianity are based of views that in US politics would be called liberal, which come straight from New Testament teachings about forgiveness, supporting the less fortunate, never discriminating, putting community before material wealth or possessions, etc.
There are a number of loud, well-financed evangelical churches in the US with a very different interpretation with a lot more old testament influence, and some powerful churches that over the years have developed their own theology (e.g. catholics) – but just because they are in the news more often, doesn’t mean they own Christianity.
But I thought Republicans were stupid and didn’t know how to read?
After looking over Amazon’s lists of “blue” and “red” books, I don’t have much confidence in these findings. My politics fall pretty close to those of President Obama, so I guess that makes me “blue”; but I own more books from the “red” list than from the “blue” list; and I saw more books on the “red” list that I might like to read than I saw on the “blue” list. Several of the books on these lists don’t really strike me as being either “red” or “blue” per se; and, at least in my opinion, a few of the books seemed to have been placed on the wrong list. Perhaps if they’d pared down their lists to include only those books that are clearly “red” or clearly “blue” — e.g. books written by icons of the right or the left, or books that specifically criticize or praise Barack Obama — their results would have been more trustworthy. But, even then, Amazon’s method assumes that liberals and conservatives are equally likely to have a preference for books that confirm rather than challenge their own preconceived notions about the world. It also assumes that liberals and conservatives are equally likely to buy bestselling books about politics, and that they are equally likely to buy their books from Amazon. I’m just not sure that any of these assumptions is warranted.
I am sorry, but in my book a good data visualization, is a data visualization that supports a decision or a forms a fact in the mind of the reader. This example left me puzzled about, what message is put forward.
My best bet is “In most states amazon ships more books with a conservative bias than a liberal”.
And I have no glue what decision can be supported by that fact, other that “if amazon wants to sell more political biased books, they should lean towards conservative messages in commercials in most states but a few.” And even that seems like to be a general bad idea…
Sometimes, that’s true. Not always. Some data visualisations are intended to let people explore facts and come to their own conclusions – to open up a question that is interesting but doesn’t necessarily have a clear answer.
Judge everything on what that one thing is trying to do, not on generalisations.
Hi All,
I agree on trying not to generalize and I think this visualization is intended to explore fact about sales about where books with political bias are shipped to by amazon.
The tricky part for me is just to leave “come to their own conclusions” hanging in the air. Data visualization is – to me – more than to leave it up to the audience to draw what ever conclusion they want. I believe that presenting data comes with a responsibility to help data to be used as a common platform for drawing common conclusions, that we might even can try to base our decisions on.
Sometimes data visualization is mere art and beauty, sometimes data visualization is a mater of life and dead decisions. I think we need to bring this difference to the front stage of every ‘appreciation’ of examples…
This infographic is clearly bogus. Everyone knows people from Mississippi can’t read!
“Everyone knows people from Mississippi can’t read!”
No, it mean that Liberals in Mississippi don’t read…they just vote for whoever has a D next to their name.
Wouldn’t it be useful to have a bubble over each state indicating the volume of books sold or better, books sold per 100.000 population, so that we see how much reading/buying books is actually happening?
Especially if more granular data were available I wouldn’t color areas because large city populations take up little space on a map compared to a desert area in NV and visually distorts the picture.
I agree with Jurgen’s point. The percentages at the top of the chart make it seem like ~5 states account for 44% of books sold… And the other 56% are distributed amongst all other states. I think there is probably a mix of conservative and liberal books purchased in each state, so a bit of a breakdown would be better (even if they still colored the states red and blue as per the majority of books purchased).
I agree with Jurgen’s point. The percentages at the top of the chart make it seem like ~5 states account for 44% of books sold… And the other 56% are distributed amongst all other states. I think there is probably a mix of conservative and liberal books purchased in each state, so a bit of a breakdown would be better (even if they still colored the states red and blue as per the majority of books purchased).
I am now interested in seeing what a similar map for Barnes and Noble would look like – perhaps two maps, one for in-store sales and one for online sales. Maybe “blue” book readers prefer to browse/buy in-store. I also dare to guess that they have easier access to bookstores.
Actually the best sellers list from the New York Times shows that the majority of political books or books written by Conservative political writers are constantly in the top 10, and stay in the top 20 for months. There are few political books written by Liberals that have done the same…maybe Barack Obama’s book some years ago, but the majority are Conservative best sellers in politics.
So people buying political books tend to be more conservative, and that includes most markets including bookstores.
It’s skewed because in so many states the public school textbooks count as “red.” ;-)
All this tells me is that conservatives read more books about politics. Which is incredibly boring to me. :)
So politics is boring to you? Don’t tell me…you’re a Liberal.
It only means that people who buy political books from Amazon buy conservative books in greater quantity. It says nothing about the non-Amazon book buying public (ie. the liberals who frequent their corner book store and pay local sales taxes to support their schools). Or that liberals may be too cheap to buy (or have less income) and therefore share more books. It also says nothing because maybe there are more conservative book titles available to buy. How many confounding non-reasons can you come up with? Or, oh my, that some liberals actually buy conservative books to be informed?