R, the open source statistical software environment, is powerful but can be a challenge to approach for beginners. For me, the best way to learn R, especially on the visualization side of things, is to dive right in. Grab some data and make some charts, or better yet, find a graph you like and try to replicate it.
R core functionality and the many available packages let you do a lot without having to know what’s going on underneath. I use this approach in Visualize This and the tutorials around here. I like the satisfaction of immediate results. Then I learn the nitty gritty later.
That said, it doesn’t hurt to familiarize yourself with the environment. Also, visualization is a small part of what you can do with R, so it can help to know what else you can do analysis-wise.
Direct from R
For starters, you can turn to R itself. Open the console, and enter help.start(). Your browser will open with links to a few manuals and a list of available packages. Of main interest is An Introduction to R. It’s in HTML format, but you can also grab the PDF version. I don’t recommend reading it from beginning to end, unless you like falling asleep at your desk.
Using R for Data Analysis and Graphics — By Maindonald, this covers similar topics as An Introduction, but it also offers exercises at the end of each chapter.
R for Beginners — This one by Emmanuel Paradis is a bit more manual-like than the previous, but it couldn’t hurt to have it available.
Books
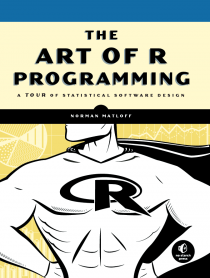
 The Art of R Programming — This takes you from beginning to end from a software development perspective. See my review here.
R Cookbook — I reviewed this one, too. If you’re familiar with other cookbooks from O’Reilly, you’ll recognize the format of this book right away.
R Graphics — Paul Murrell’s book is actually too advanced for people new to programming. Plus it’s priced academically (read that as expensive textbook). But if you’re already a coder familiarizing yourself with R’s graphics engine, this is a good one. Don’t get this if you’re looking for a package or plotting function reference.
Online and Shorter
The manuals and books can be a lot to take in though when you want to get to work on your own data as soon as possible. Here are a couple of resources where you can get nibbles at a time.
R twotorials — This is a collection of 90 two-minute videos by Anthony Damico. Prepare yourself for some fast talking. I’m a slow person in general, so it’s rushed for me, but I imagine this could be an interesting three-hour cram session. Just don’t blame me if your head explodes.
R Bloggers — There are people scattered across the Web who blog about R. This is simply an aggregator of many of those feeds.
Additionally, despite what some say, the documentation for R is actually pretty good if you know how to use it. Simply enter a question mark followed by the function name for a description of that function and usage. For example, enter ?plot for documentation on plot().
Google is also helpful, which often takes you to Stack Overflow. A search for R used to turn up all sorts of unrelated junk, but it has gotten a lot better. Sometimes it’s helpful to include “r-project” or “rstats” in your query to make the search for a letter less ambiguous.
Finally, #rstats on Twitter is the common hashtag for questions and comments.

 Visualize This: The FlowingData Guide to Design, Visualization, and Statistics (2nd Edition)

Your list is a useful resource. The Art of R Programming is good, but soon into it a beginner will most likely struggle.
I found ‘A Beginner’s Guide to R’ a very good introductory text.
http://www.amazon.com/Beginners-Guide-Use-ebook/dp/B003VM7G3I
Re: finding r stuff in Stackoverflow: One can use StackOverFlow’s tagging system to help keep things on R stuff. Here is an example: http://stackoverflow.com/search?q=%5Br%5D+matrix
It looks like the search system encloses tags in [].
Don’t forget Hadley Wickham’s “ggplot2” package! One of the easiest ways to make really good-looking visualizations in R. His website (http://had.co.nz/ggplot2/) explains most things, but he also has a book, although $55 is a bit steep:
http://www.amazon.com/gp/product/0387981403
Nathan, two resources I found very useful are Quick-R (http://www.statmethods.net/) and the UCLA Stat Computing R resources pages – http://www.ats.ucla.edu/stat/r/.
Plug: I’d love to hear any feedback you or your readers may have on my R Graphs Cookbook (http://www.amazon.com/R-Graph-Cookbook-ebook/dp/B0056ZUJ46/ref=sr_1_2?ie=UTF8&qid=1338832776&sr=8-2).
Thank you for the links Nathan :)
I’d like to second the recommendation of Quick-R (http://www.statmethods.net/) – definitely the R site I refer to most often, especially for simple things that I shouldn’t have forgotten, but have!
If you’d like to get started with R charts without having to do programming you can try Trellis Charts for Excel. It is based on the R Lattice package. http://trellischarts.com
Disclaimer: I’m the developer.
Another great beginner guide is R For Dummies, out this month (http://www.amazon.com/For-Dummies-Computer-Tech/dp/1119962846/ref=sr_1_1?ie=UTF8&qid=1339067859&sr=8-1)
Authors Joris Meys & Andrie de Vries really know their stuff!
Regarding search difficulties in Google, there is this website which is a sort of “R oriented Google” http://www.rseek.org/