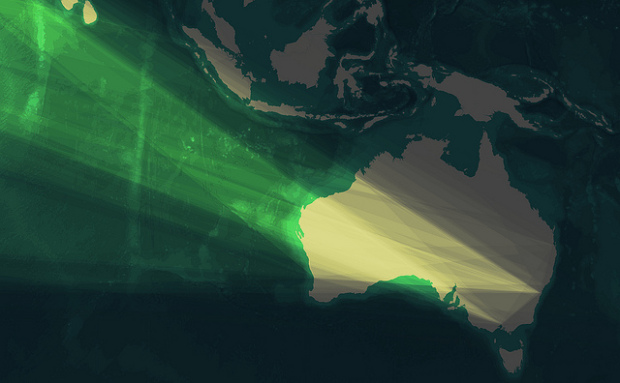
TileMill is a tool that makes it easy to create interactive maps. Soon they will be adding some new features that will treat maps more like images in terms of modifying the look and feel. This will allow you to apply blending to polygons and GIS data.
AJ Ashton made these examples that are quite compelling, beautiful, and just touch on the possibilities. I can envision many different types of data being drawn with blending techniques as opposed to simply flow diagrams and the like. It will be interesting to see what comes out of these new features.
[via @bonnie]
 Visualize This: The FlowingData Guide to Design, Visualization, and Statistics (2nd Edition)