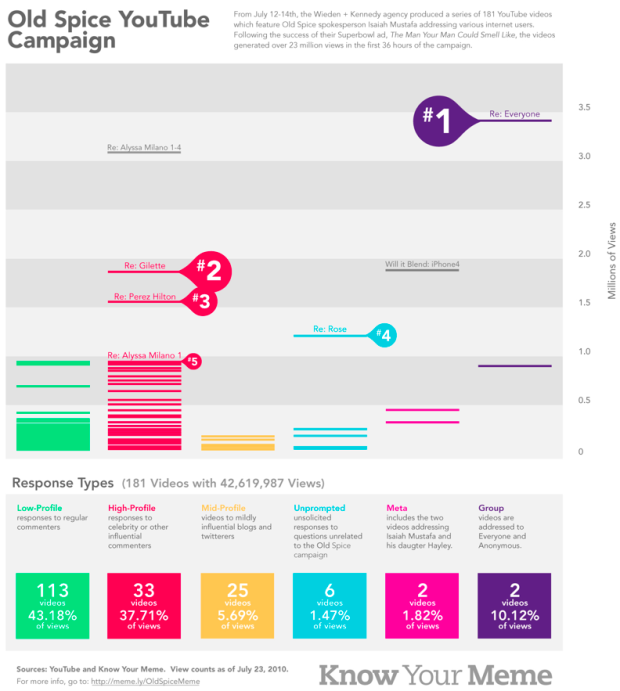
I trust we’ve all seen the OldSpice YouTube campaign by now? This graphic from Know Your Meme categorizes videos by who they were directed to and how many views they received. For example, a video to Joe Blow would be in the low-profile category, while responses to Alyssa Milano go to the high-profile category.
It’s fun subject matter and interesting to look at, but it does miss some chances to be more informative. I mean, the story here isn’t just number of views. It’s more about the distribution of views and videos. We don’t really get that from these visuals. Instead the main thing we get out of the graphic is the five most viewed videos.
That’s not to say it’s bad. But there is a good amount of room for improvement. How can we make this graphic more meaningful and tell a more complete story? Here’s the full-sized version. Leave your constructive comments below.
[via]
 Visualize This: The FlowingData Guide to Design, Visualization, and Statistics (2nd Edition)
I’m sorry, but I have to disagree with your position. I find this graphic unreadable. Even after your explanation I still have no idea what I am looking at.
It might be more interesting to see time series of the # of views on a couple of categories of responses and total responses. That would tell how fast that thing takes off.
Within the time series, they can also show when Old Spice enters Trending Topics and its position in Trending Topics.
They probably don’t have the data, but I would love to see the time series broken down to where the views come from: twitter, youtube directly, facebook, other.
This graph has way too many categories of responses, and some of them are just not important. It says very little with so much ink and colors.
http://www.visiblemeasures.com/adage – you should check out this site.
It’s a company I’ve worked with, they are awesome, and have really innovated in the digital video measurement space. They have rankings of popular ads, and other internet videos as well, aggregated across all major video viewership platforms, and in many cases when it comes to ads, across the brand site.
Definitely a lot of interesting data to be had – as well as a pretty awesome company.
I’d love to work for them, but I don’t want to move to Boston.
~Sam