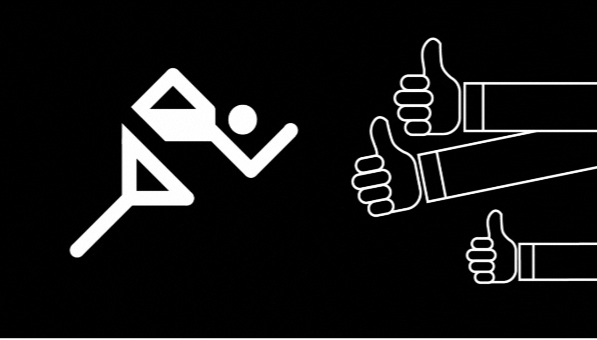
Every Olympics since 1936 has had a series of pictograms (i.e. icons that look like restroom signs) that represents the events. Here are pictograms for the Vancouver games, and here they are for the Beijing Olympics. Some series are distinct while others clearly sucked it up. Designer Steven Heller discusses the evolution of these Olympic pictograms in this video for The New York Times. Which set do you like best?
Evolution of Olympic Pictograms
FlowingData Delivered to Your Inbox
7 Comments
Second Edition
 Visualize This: The FlowingData Guide to Design, Visualization, and Statistics (2nd Edition)
 Visualize This: The FlowingData Guide to Design, Visualization, and Statistics (2nd Edition)
New tools, refined process.
I read this as “hitchhiking for martini’s and a portable gas can.” It is just me?
haha, well that’s all i see now. it’s much clearer in the video though :)
Pingback: somerandomdude: Evolution of Olympic Pictograms https://flowingdata.com/2010/02/26/evolution-of-olympic-pictograms/ - Some Random Dude
Pingback: Evolution of Olympic Pictograms | @FlowingData « ImJustCreative
Pingback: The History of Olympic Pictograms [video] « WebGlide - Data-Visualization
Pingback: Weekly Roundup: Design Related Links #10 « Discovery Session… by Gerard Dolan
Pingback: Brooklyn Landsharks » New Brooklyn Landsharks Merch!!