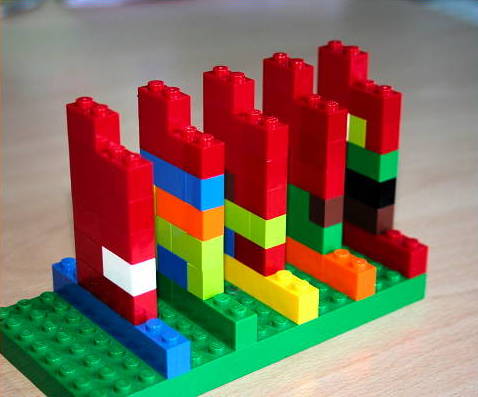
Speaking of physical graphs, looks it’s time management with my favorite childhood pastime – LEGOs! Each row represents an hour and each color indicates a different project. I’m gonna go out by myself a big, red bucket of LEGOs now.
[via infosthetics]
 Visualize This: The FlowingData Guide to Design, Visualization, and Statistics (2nd Edition)
Pingback: Time Management - Blogwatch - More Tips and Tricks? Let’s hope not - Time Management Resources from AskTheManager.com