We need to interact with others. We crave connections with friends and strangers. Something inside makes us need to converse with others so that we don’t go crazy. As I work from home, I’ve begun to understand this a bit more, and I’ve found myself checking Facebook and Twittering perhaps just a little too much. I think that it’s these connections is what has made social networks so popular.
How can we visualize these ever so important connections. An obvious option is with, well, lines.
Pretty, yes. Useful? Umm, hmm, not really. The number nodes grows to greater than 20, and it becomes this cloud/blob-type thing. What meaning can we take away from visualization like this other than, there’s a lot of nodes and links, and they’re all interconnected (other than a few outsiders)?
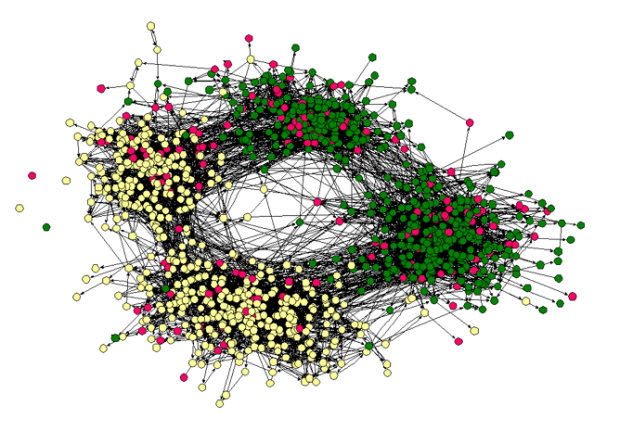
Okay, so here’s another option — instead of using lines to show connections between nodes, we can use clustering. Nodes that are similar, appear closer together.
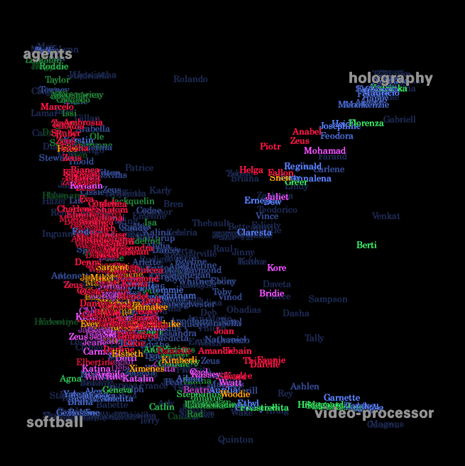
We can see some patterns now with the clustering and coloring, but when the network groes to thousands, it’s easy to see how things can get kinda gross. I think the natural next step here is to sample, provide an overview, and if the user wants to go deeper, sample some more.
The big question: how do we know what to sample? What weight can we give each sample? How can we get a sample that properly represents the entire network (or a small, specific part of it)?
 Visualize This: The FlowingData Guide to Design, Visualization, and Statistics (2nd Edition)
I am struggling with this exact problem right now. Have you tried drawing social networks in R? When N is large, they look terrible and take days to do!
If you’re interested, check out the NetworkX package in Python. It produces some pretty nice visualizations. So does Rgraphviz. Of course, as you mentioned, the graph doesn’t tell you much.
Regarding sampling social networks…I am considering that for a thesis… ;-)