When Google first launched their visualization API, you could only use data that…
-
Google Visualization API Opens Up
-
Showing This Many Per Second – Data Humanized
I’ve always thought one of the best ways to make data relate-able is…
-
Thank You, FlowingData Sponsors
FlowingData continues to grow, and FlowingData sponsors continue to help keep everything running…
-
Steve Jobs on Design
Most people make the mistake of thinking design is what it looks like……
-
Best of FlowingData: October 2008
October was another good month. Our FlowingData community grew from 5,100 subscribers to…
-
European Economic Weather Map – Sudden Change in Outlook
In this map from the Financial Times, the state of Europe’s economy is…
-
Tracking Weight and What You Eat with Twitter
I’m sure this will come as no surprise to all of you, but…
-
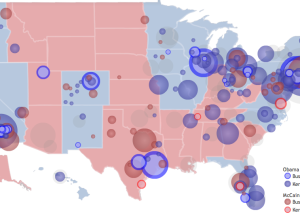
Map Shows Newspaper Endorsements in US Presidential Election
Philip, from infochimps, maps newspaper endorsements using data from the Editor & Publisher’s…
-
More Google Reader Stats When ‘show details’
I just noticed that when you click on “show details” in Google Reader,…
-
New York Times Visualization Lab – Collaboration with Many Eyes
It was just a little over a week ago that The New York…
-
A Bunch of Japanese Women’s Bra Responses
Uniqlo gathered hundreds of responses from a couple hundred Japanese women about bra…
-
Have You Checked Out the FlowingData Forums Yet?
I started the FlowingData forums a few months ago to give others a…
-
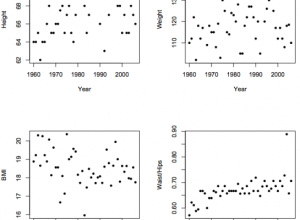
Playboy Playmate Curves and the State of the Economy
Terry Pettijohn and Brian Jungeberg of Mercyhurst College took a very close look…
-
Download Your Free FlowingData Wallpaper
I don’t remember when I made this desktop wallpaper, but it was probably…
-

Get a Good Night’s Sleep with SleepTracker Pro [Review]
I’ve had sleep troubles for as long as I can remember. When I…
-
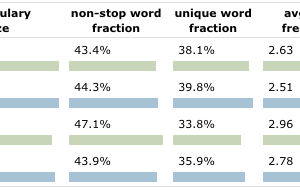
Lexical Analysis of Presidential Debates and the Windbag Index
Martin Krzywinski, whose previous work includes Circos, digs deep into the presidential debate…
-
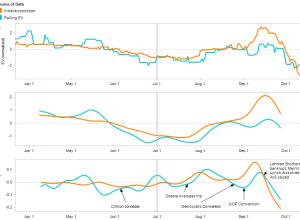
Who’s Leading Whom? Predictive Markets Versus Polls
This is a guest post from Michael Drumheller, Dirk Karis, Raif Majeed and…
-
Code For Walmart Growth Visualization Now Available
It took me three months to do it, but the code to visualize…
-

40 Essential Tools and Resources to Visualize Data
One of the most frequent questions I get is, “What software do you…
-
Comparative View of Length of Rivers and Height of Mountains
I had no idea these comparative views of length of rivers and heights…
Recently for Members
Second Edition
 Visualize This: The FlowingData Guide to Design, Visualization, and Statistics (2nd Edition)
 Visualize This: The FlowingData Guide to Design, Visualization, and Statistics (2nd Edition)
New tools, refined process.
Browse by Chart Type See All →


