I had to install a new caching implementation a few days ago to…
-
A Small Favor
-
Using Data Visualization to Forecast Financial Markets
This is a guest post by Simit Patel of InformedTrades, which offers free…
-
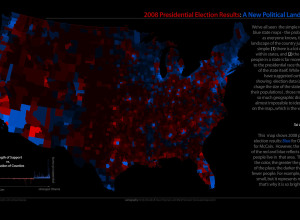
Cotton Picking Correlates to President Picking
The U.S. election is over. The post-election analyses begin. The above map shows…
-
Mmm, Chocolate Pie… Chart
In the spirit of turning pie charts into food, Mary and Matt kick…
-
Word Portraits of Famous People – Einstein and Ginger the Cockapoo
Jeff Clark of Neoformix has been doing some cool stuff with words lately.…
-
Minority Report Physical Interface in Real Life – Oblong g-speak
Remember the awesome interface in Minority Report? You know, the one where Tom…
-

Open Thread: I Don’t Care About the Data…
Martin briefly discusses a presentation at a recent visualization workshop. The speaker blurts,…
-
Vote for Open Government Data
The title reads, “Barack Obama is going to appoint the nation’s first CTO.…
-
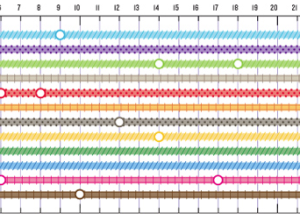
Alternative to Cartograms Using Transparency
The thing about cartograms is that it’s hard to make out what you’re…
-
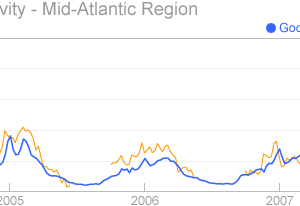
Google Uses Search Terms to Predict Flu Activity
In Google Flu Trends, Google uses related searches to predict flu activity in…
-
FlowingData Gets a Facelift – Now 10x Sexier
Anyone who has a blog can attest to this. No matter how much…
-
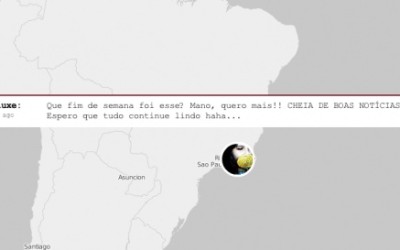
672 Obama Headlines – Both Browsable and Readable
Vertigo put together a great collection of 672 Obama headlines using Silverlight’s deep…
-
Wanna Work For Stamen Design?
I don’t normally put up job postings, but this opportunity is too cool…
-
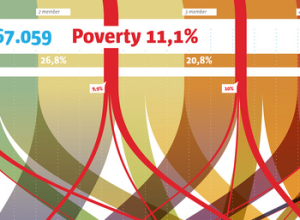
Exploration of Our Presidents’ First 100 Days in Office
GOOD Magazine and Atley Kasky collaborate to explore U.S. Presidents’ first 100 days…
-
Maps and Cartograms of 2008 Presidential Election
Cartograms got a lot of coverage in 2004 when Michael Gastner, Cosma Shalizi,…
-
Diagrams Galore in Diagram Diaries Flickr Group
For those watching the clock and waiting for the weekend to hurry up…
-
Sprint Dashboard to the Universe – Plug Into Now
Sprint, in a promotion to their mobile Internet service, created this amusing futuristic…
-
How to Make Your Own Twitter Bot – Python Implementation
Following up on my post last week about using Twitter to track eating…
-
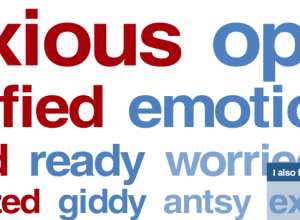
Obama and McCain Voters’ Current State of Mind
The New York Times adds another item to the list of things to…
-
Reminder: It’s Election Day
A quick reminder — it’s election day in the United States. If you’re…
Recently for Members
Second Edition
 Visualize This: The FlowingData Guide to Design, Visualization, and Statistics (2nd Edition)
 Visualize This: The FlowingData Guide to Design, Visualization, and Statistics (2nd Edition)
New tools, refined process.
Browse by Chart Type See All →


