Graduate student researchers are pretty much putting sensors in everything these days. There’s…
-
Sensors in Footballs – Was the Pass Good?
-
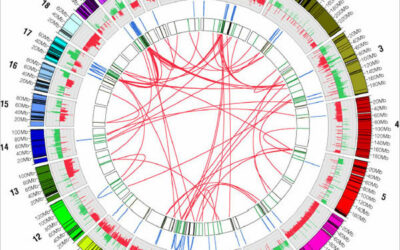
Researchers Map Chaos Inside Cancer Cell
The thing about cancer cells is that they suck. Their DNA is all…
-
Budweiser Maps Drinkabilty of Bud Light Beer
Yes, watered down and flavorless beer has high drinkability. You know, sort of…
-
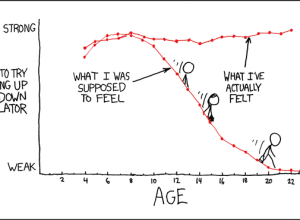
Because It’s Friday: Escalators
[via xkcd | Thanks, Justin]…
-
FlowingData Takes A Break
FlowingData posts will slow down this holiday week. I’m going to be busy…
-

All You Can Eat at the Twitter Data Buffet
Philip from infochimps posts the results of some heavy Twitter scraping. Data for…
-
Top FlowingData Posts for 2008
It’s hard to believe that another year has come and gone, but as…
-
Urban Heartbeat of European Cities – Urban Mobs
During major events, people use their mobile phones to share their emotions: the…
-

From the Forums: Contests, Self-surveillance, and Attachments
I made a few updates to the FlowingData forums last night – the…
-
Because It’s Friday
Have a good weekend all. I’ll be getting buried in the expected 12…
-

5 Best Data Visualization Projects of the Year
Data visualization continues to grow online and in the real world. It exists…
-
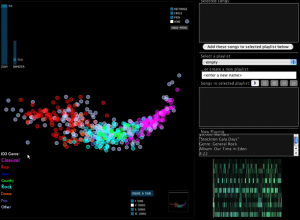
Visualize Music Collections With MusicBox
The great thing about being a graduate student is that you get to…
-

Sculptural Data Visualization – Stock Market and GDP
In his latest data sculptures, Andreas Nicolas Fischer places data visualization in a…
-
How to Make a Graph in Adobe Illustrator
You can use the vector-based software normally reserved for designers and artists to make and edit charts.
-
Win Free iPod Touch – SiSense Dashboard Challenege
SiSense is running a dashboard competition, and a free iPod Touch is up…
-

Do You Hate Statistics as Much as Everyone Else?
Photo by Darwin Bell
It happened again. I told someone I study statistics.… -

Scientists Can Now Map Your Dreams to an Image
I thought this was a joke when I first read it, but scientists…
-

Magically Reformat Data to Get it How You Need it
One of the more painful parts of analysis or visualization is that you…
-
Winner of Tufte Books and Many Other Good Entries
I ran a contest last week to improve a graph from Swivel that…
-
What Jobs Are There in Data Visualization?
I got an email from Harald asking, “How does the job market for…
Recently for Members
Second Edition
 Visualize This: The FlowingData Guide to Design, Visualization, and Statistics (2nd Edition)
 Visualize This: The FlowingData Guide to Design, Visualization, and Statistics (2nd Edition)
New tools, refined process.
Browse by Chart Type See All →


